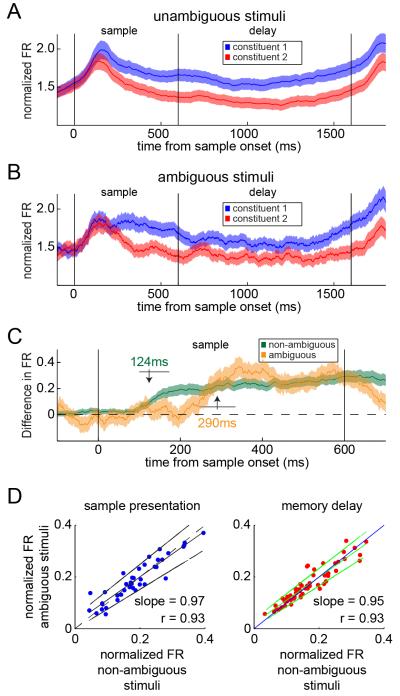
Figure 5.
Latency of category sensitivity.The average (mean+/−SEM) neural response for the preferred category of PFC neurons that maintained the same preference during trials with unambiguous (A) and ambiguous (B) stimuli. (C) The maximum rise time was calculated in a 50 ms window centered on the first time point of significance in the difference in neural activity. It took significantly longer during the guessing trials than the unambiguous trials (124ms versus 290ms). (D) Comparison of normalized neural responses averaged over the sample presentation (left panel) and the memory delay (right panel) for unambiguous and ambiguous stimuli. The activity level of the population of PFC neurons were similar with both types of stimuli with slopes not different from unity. Note the number of trials in the unambiguous averages was stratified to match the lower number of ambiguous trials.

