
Figure 3. Bags of Temporal Features.
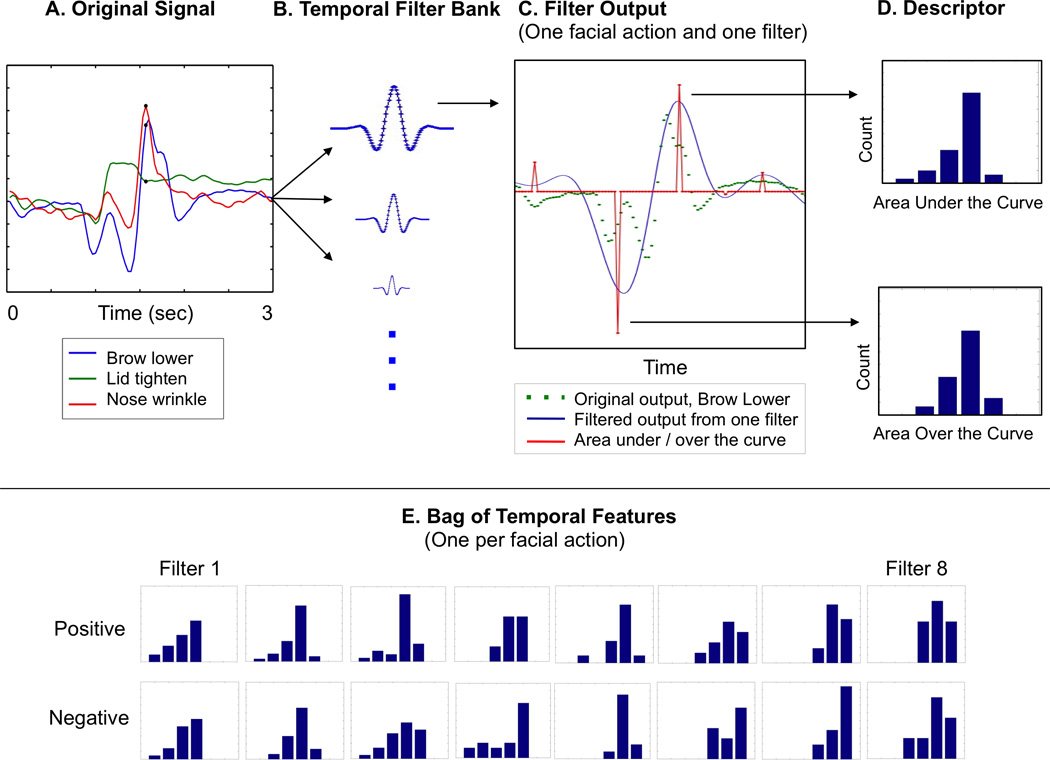
Here we illustrate an exemplar of one stimulus as it is processed by each step. A. Sample CERT signals from one subject (Black circles indicate the time point of the face image shown in Figure 2). Three seconds of data are illustrated, but processing is performed on the full 60 seconds of video. B. The CERT signals were filtered by temporal Gabor filters at eight frequency bands. C. Filter outputs for one facial action (brow lower) and one temporal frequency band (the highest frequency). D. Zero crossings are detected, and area under / over the curve calculated. The descriptor consists of histograms of area under the curve for positive regions, and separate histograms for area over the curve for negative regions. (Negative output is where evidence indicates absence of the facial action.) E. Full bag of temporal features for one action (brow lower). Consists of eight pairs of histograms, one per filter.