
Figure 4. Contribution of temporal information.
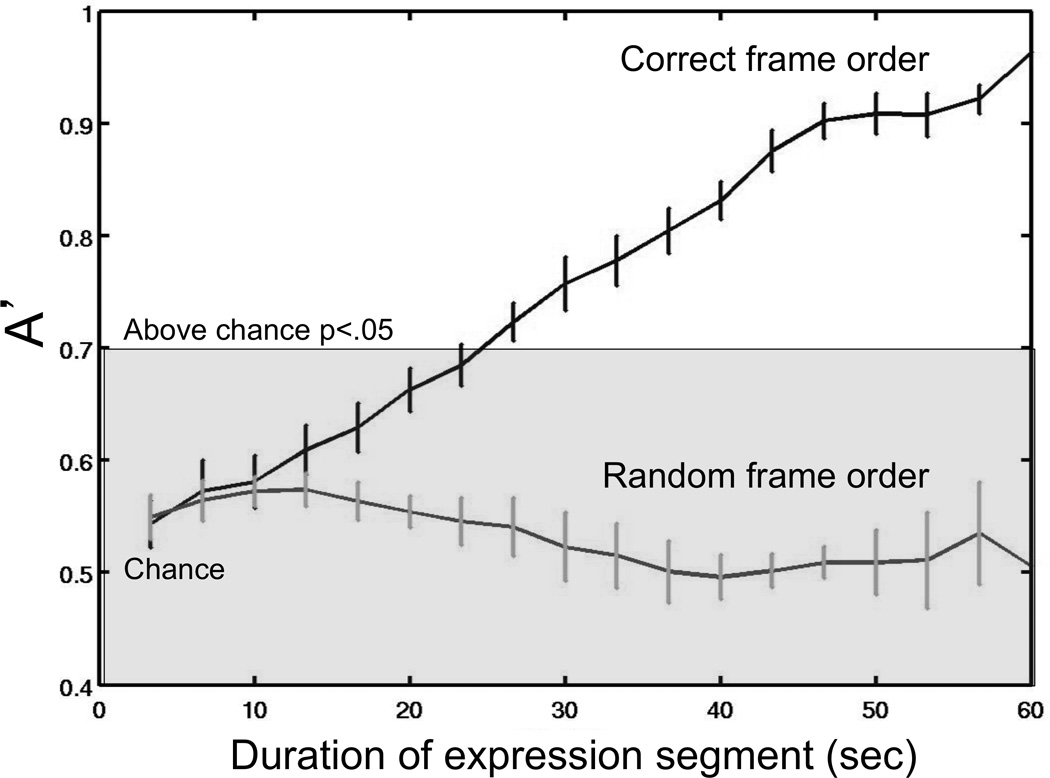
Classification performance (A’) is shown for temporal integration window sizes ranging from 10 seconds to 60 seconds. Windows were sliding and then performance was averaged across temporal position. Performance is shown for the 5-feature system. The region above the shaded region is statistically significant at the p < .05 level. Error bars are one standard error of the mean.