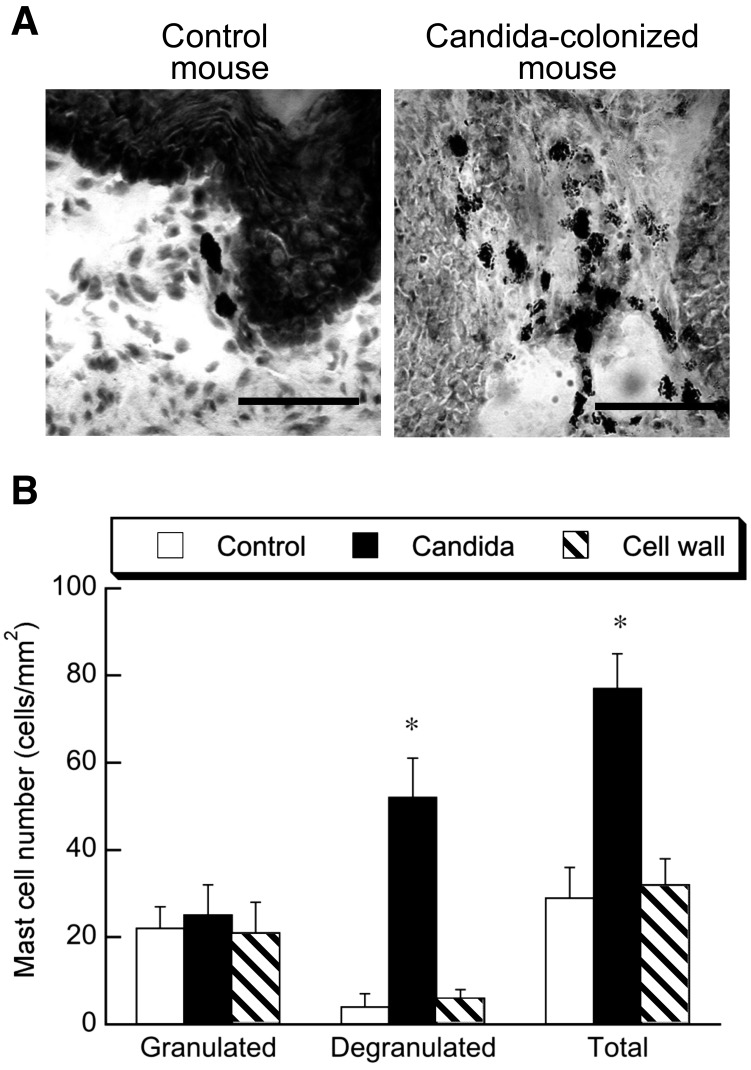
Fig. 2.
Effect of C. albicans gut colonization and cell wall administration on mast cell degranulation in the forestomach of BALB/c mice. Chart A shows a representative section of forestomach tissue stained with toluidine blue. The bars represent 100 μm. Chart B shows the number of granulated and degranulated mast cells and the total number of mast cells in the forestromach. Values are given as means ± SEM of 6 mice per group. *, p < 0.05 vs. control.

