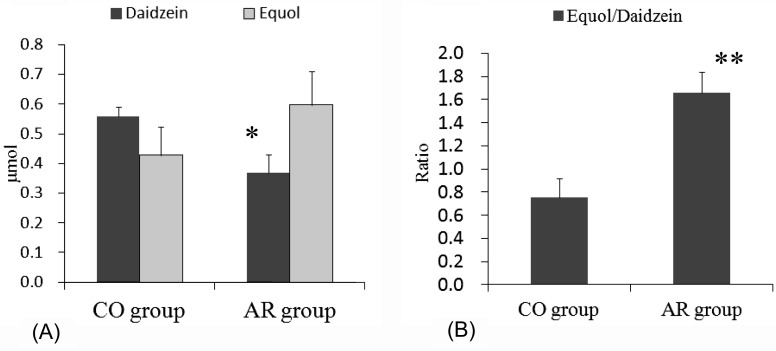
Fig. 1.
(A) Amounts of urinary isoflavonoids (aglycones+metabolites) of mice in the AR group and the CO group. Values are means ± SE (n=7). *Significantly different (p<0.05) from the CO group. (B) The ratio of equol/daidzein from the amounts of urinary isoflavonoids (aglycones+metabolites) of mice in the AR group and the CO group. Values are means ± SE (n=7). *Significantly different (p<0.05) from the CO group. The data were analyzed using t-test analysis. Statistical significance was reached with a p value of less than 0.05.

