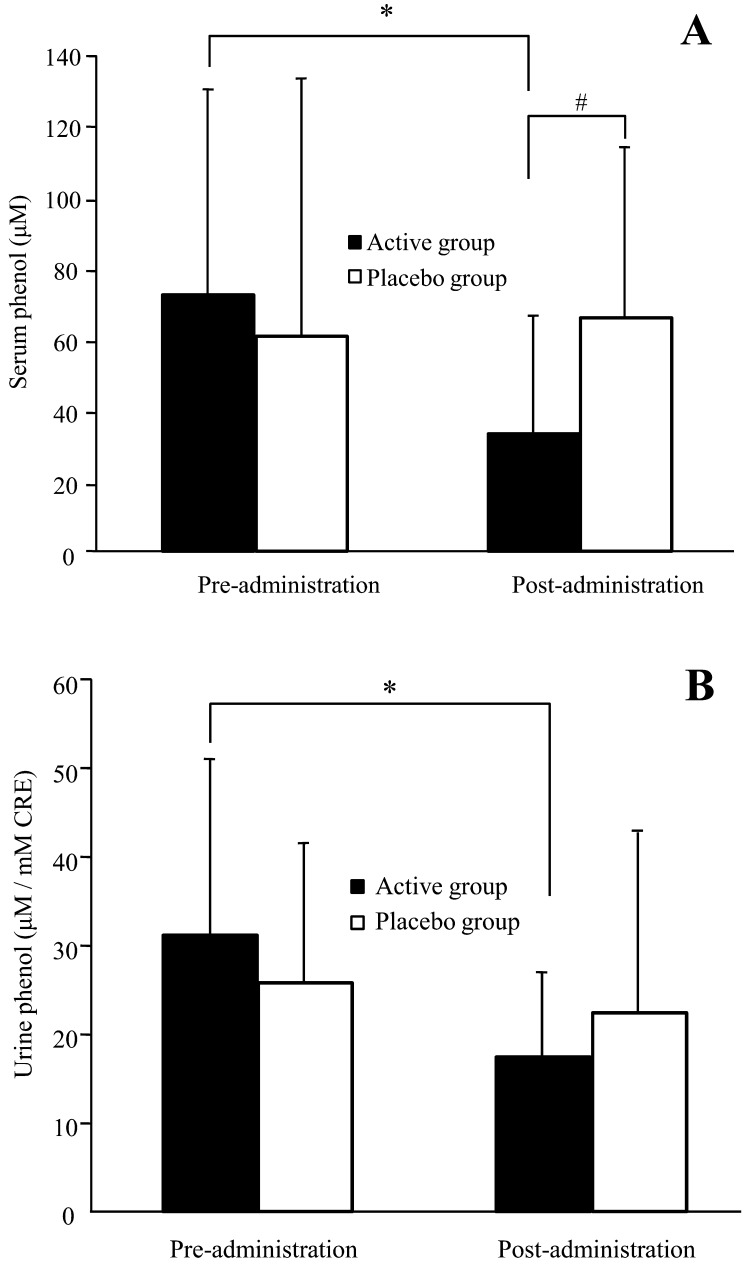
Fig. 3.
Phenol levels in serum (A) and urine (B) in healthy adult women. Values are expressed as mean ± SD values for volunteers with detectable levels; active group, n = 20; placebo group, n = 19. *p<0.05 comparing pre- and post-administration values by the paired t-test. #p<0.05 comparing the active group with the placebo group by ANCOVA.

