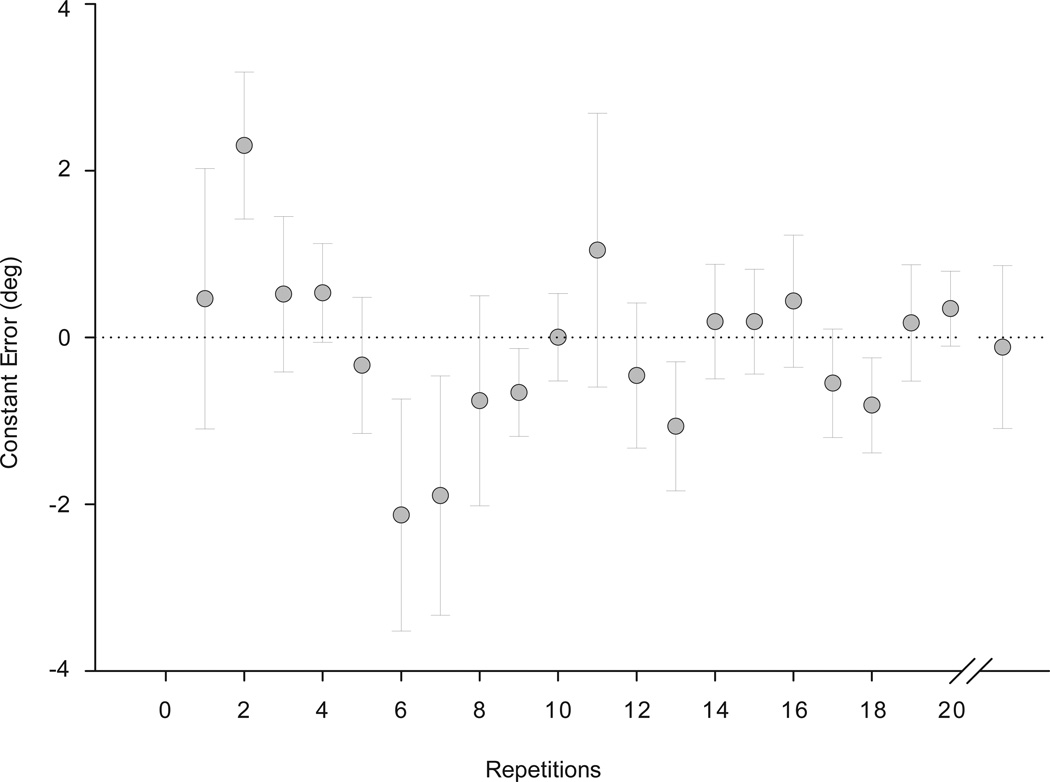
Figure 2.
Mean constant error values of the 19 subjects during the practice trials at a constant velocity of 20°/s. Data points are means of all subjects and error bars are standard errors. Repetitions 1, 6, and 11 were conversion zones for change in feedback. The last data point on the graph is the mean (standard error) of the target trials at the random velocity of 20°/s.

