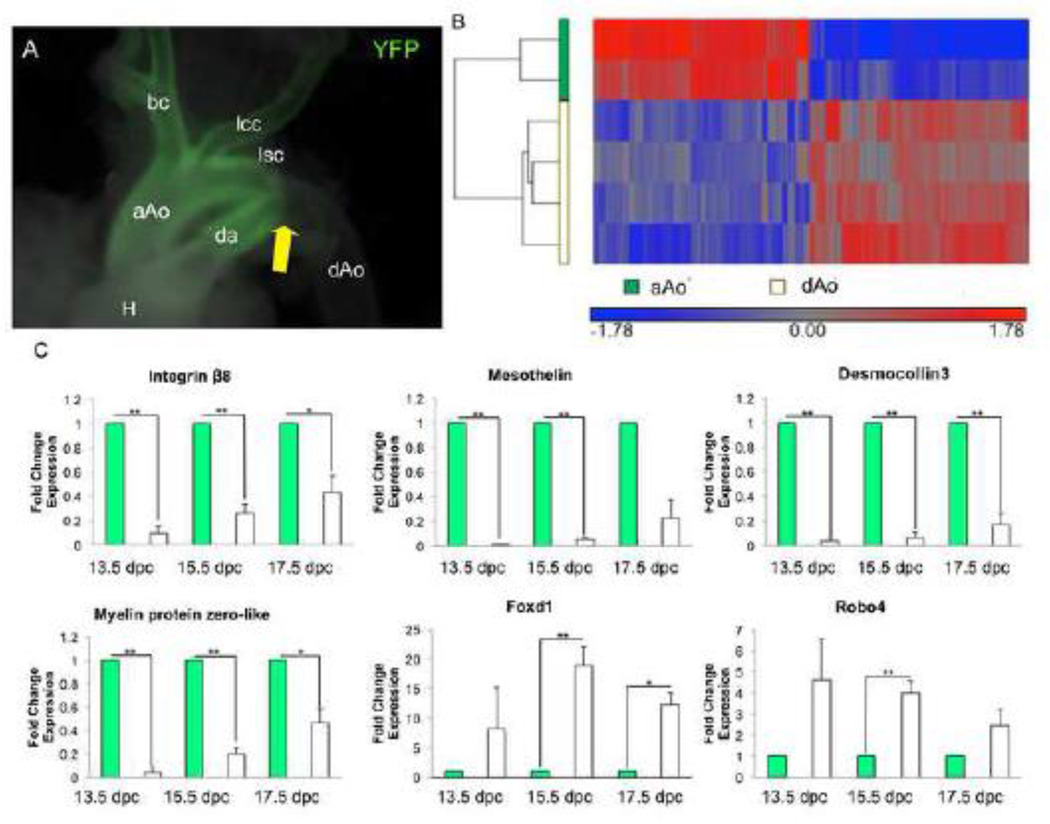
Figure 1.
Embryonic regions of the aorta have distinct gene expression profiles. A) Wnt1-Cre; R26RYFP lineage labeled aorta demonstrating the border between the aAo and dAo. White arrow points to the border between the NC- and somitic-derived VSMCs. B) Hierarchical clustering of 1,475 probes detected as significantly different (at least 1.5-fold, B-H p value < 0.05) between control aAo and dAo samples. Values shown are log base 2, and bright red, bright blue, and gray indicate the highest, lowest, and median normalized signal values, respectively. Vertical dendrograms represent the individual samples, of which there are two to four replicates for each sample type. C) qRT-PCR on RNA taken from aorta samples throughout development. Abbreviations: aAo, ascending aorta; bc, brachiocephalic artery; da, ductus arteriosus; dAo, descending aorta; H, heart; lcc, left common carotid; lsc, left subclavian. Error bars represent SEM. *, p≤0.05; **, p≤0.01

