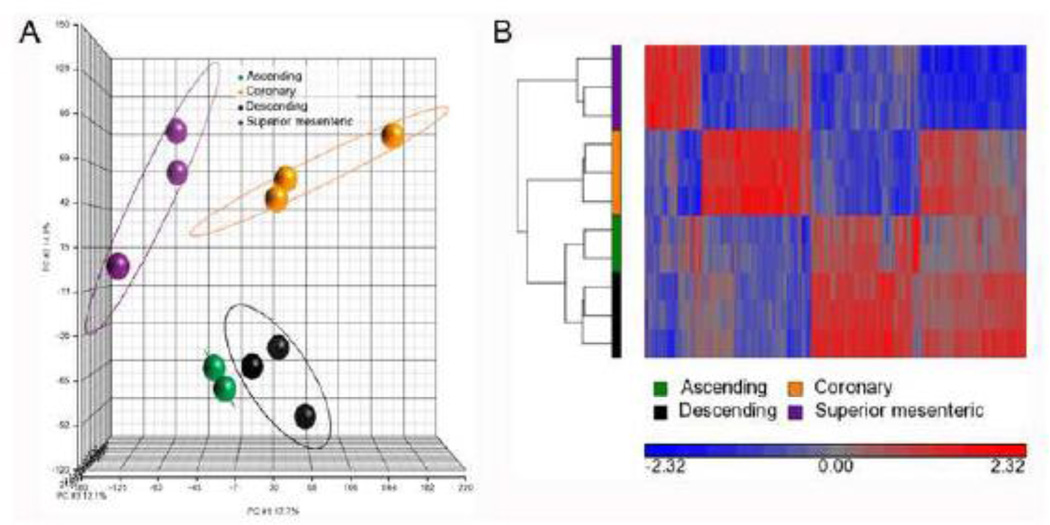
Figure 4.
Adult vessels have different gene expression patterns, however the regions of the aorta have similar profiles. A) Principal components analysis of four different blood vessel tissues: ascending aorta (red), descending aorta (green), coronary artery (blue), and superior mesenteric artery (purple) is shown. The colors represent the different sample replicates, as indicated in the legend, and circles mark the ellipsoids (+/− standard a deviation of 2) for each group. The X-axis, Y-axis, and Z-axis components represent 17.7%, 14.8%, and 12.1%, respectively, of the total variability between experimental replicates. B) Hierarchical clustering of 1,496 probes detected as significantly different (at least 1.5-fold, B-H p value < 0.05) between ascending aorta, descending aorta, coronary, and superior mesenteric arteries. Values shown are log base 2, and bright red, bright blue, and gray indicate the highest, lowest, and median normalized signal values, respectively. Vertical dendrograms represent the individual samples, of which there are three replicates for each sample type (two replicates for ascending aortic tissue).

