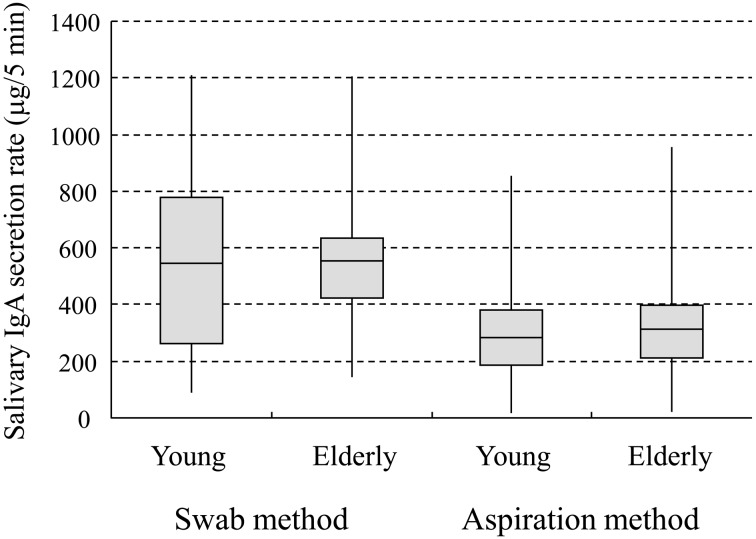
Fig. 2.
Box-whisker plot of salivary IgA secretion rate
Distribution of salivary IgA secretion rate (µg/5 min) among the young and elderly participants, in samples collected by the swab and aspiration methods. The box-whisker plot displays the mean, quartiles, and the minimum and maximum values observed for each group. The plot elements and the statistics they represent are as follows: the length of the box represents the interquartile range (the distance between the 25th and 75th percentiles); the horizontal line in the box interior represents the mean; and the vertical lines issuing from the box extend to the minimum and maximum values of the analysis variable.

