
Figure 1.
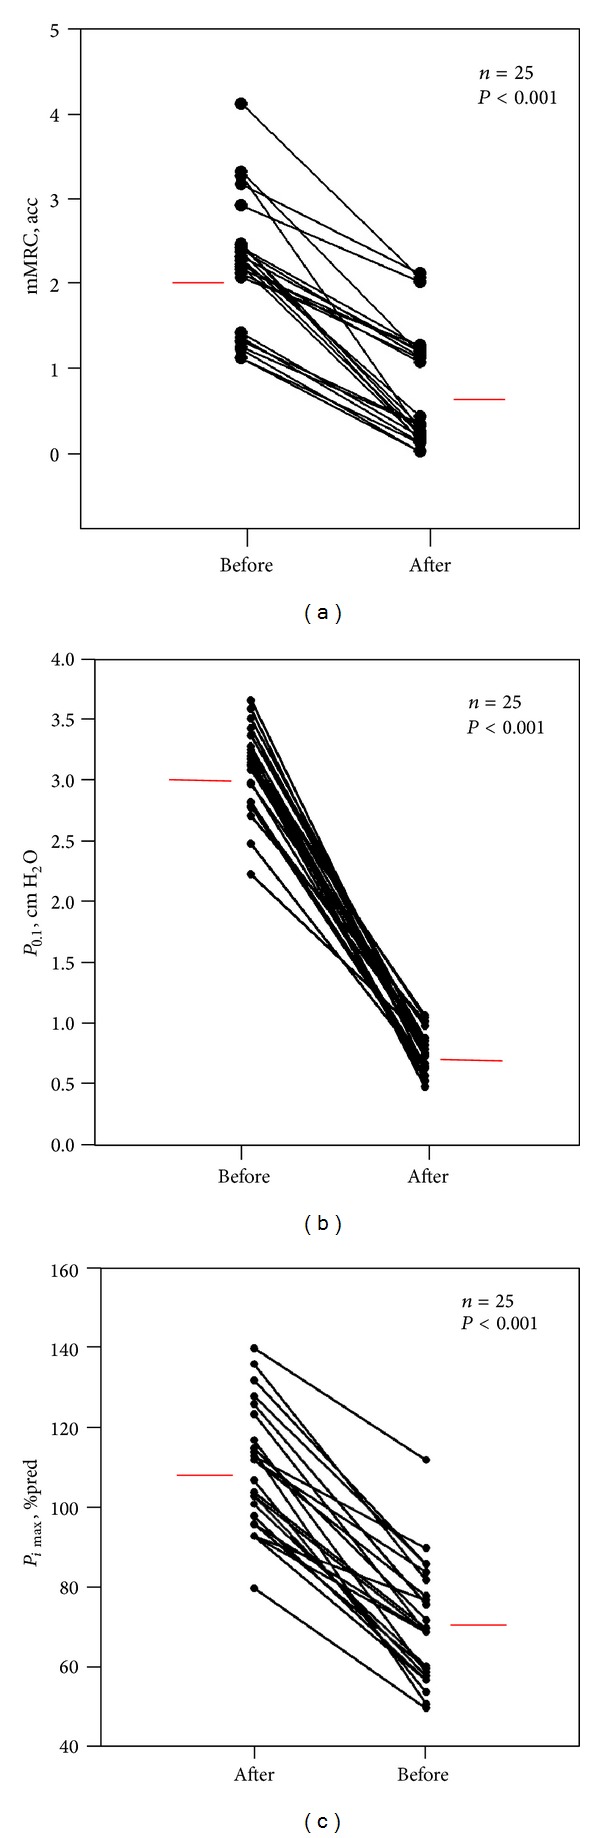
(a) mMRC, (b) P 0.1—ventilatory drive, and (c) P imax before and after hemodialysis are shown. Black dots represent the individual patients and red lines represent the mean values before and after hemodialysis.
Official websites use .gov
A
.gov website belongs to an official
government organization in the United States.
Secure .gov websites use HTTPS
A lock (
) or https:// means you've safely
connected to the .gov website. Share sensitive
information only on official, secure websites.
(a) mMRC, (b) P 0.1—ventilatory drive, and (c) P imax before and after hemodialysis are shown. Black dots represent the individual patients and red lines represent the mean values before and after hemodialysis.