
Figure 2.
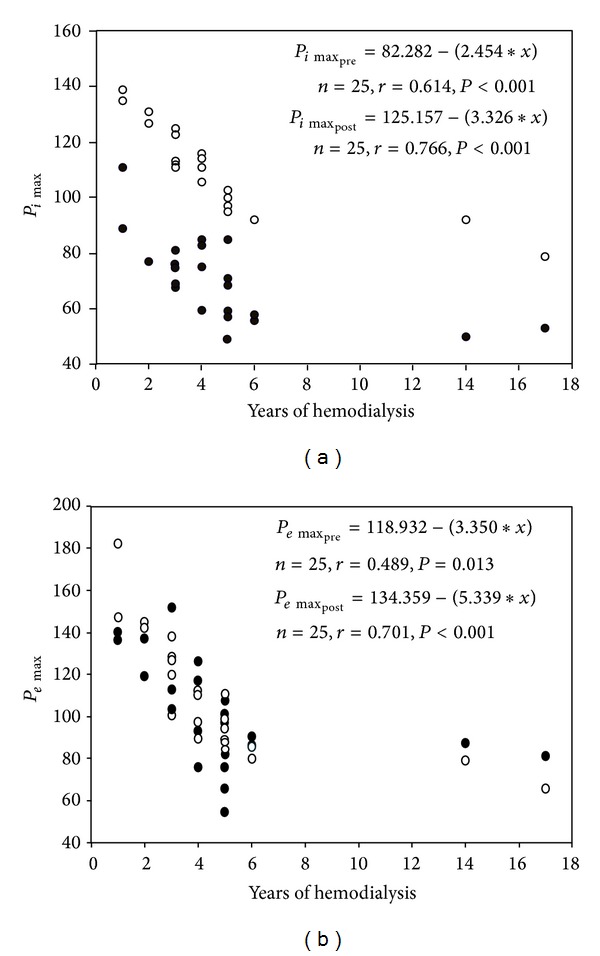
(a) Relationship of the P imax with the duration of hemodialysis for the 25 patients before and after hemodialysis (r = 0.614, P < 0.001 and r = 0.766, P < 0.001, resp.). Black dots: P imax before hemodialysis. White dots: P imax after hemodialysis. (b) Relationship of the P emax with the duration of hemodialysis for the 25 patients before and after hemodialysis (r = 0.489, P = 0.013 and r = 0.701, P < 0.001, resp.). Black dots: P emax before hemodialysis. White dots: P emax after hemodialysis.