Figure 4.

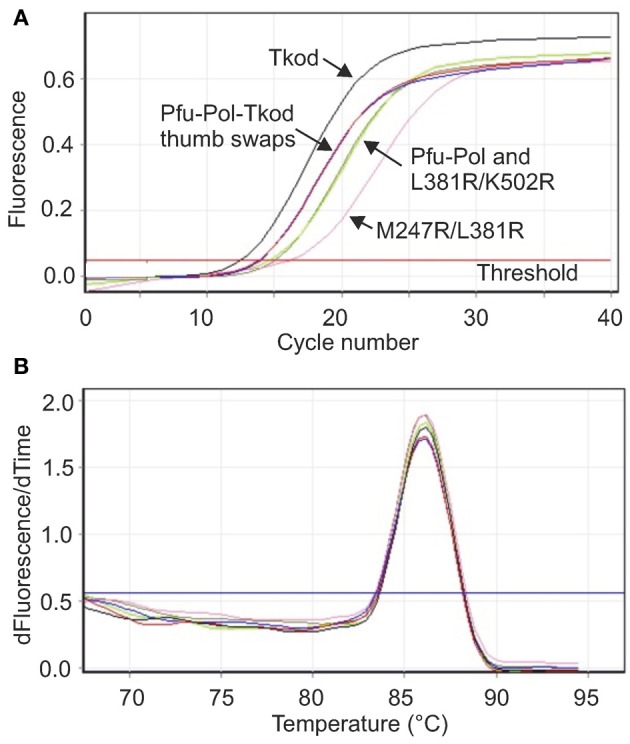
Real time PCR analysis of polymerase performance. (A) Amplification of a stretch of yeast genomic DNA 232 bases in length using 10 s extension. The lines that correspond to the individual polymerases are identified on the figure. Pfu-Pol TS and Pfu-Pol TS L381R/K502R (indicated Pfu-Tkod thumb swaps) gave near superimposable lines. Likewise the lines for Pfu-Pol and the double mutant L381R/K502R overlapped strongly. (B) Melting temperature analysis (first derivative showing the rate of change of temperature with time against time) of the amplicons generated in (A). All the polymerases gave exclusively the desired product as indicated by a single peak with a Tm of 86°C. As all the lines are essentially identical the individual polymerases have not been identified. In both panels only a single line for each polymerase is shown but all experiments were carried out in triplicate.
