
Fig. 2.
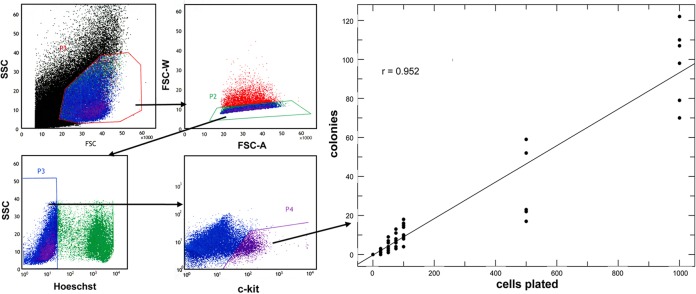
Cell dose response of erythroid colonies derived from single cells. (Left) Day 6 EBs were dispersed, gated for singlets, sorted for viability (Hoechst-) and Kit+ expression before plating in methylcellulose at varying concentrations. (Right) Results from inspection of 60 platings derived from five separate experiments are shown as a regression analysis between cells plated and colony number, leading to a correlation coefficient (r) of 0.952 (P<0.001) and a slope of 0.094.