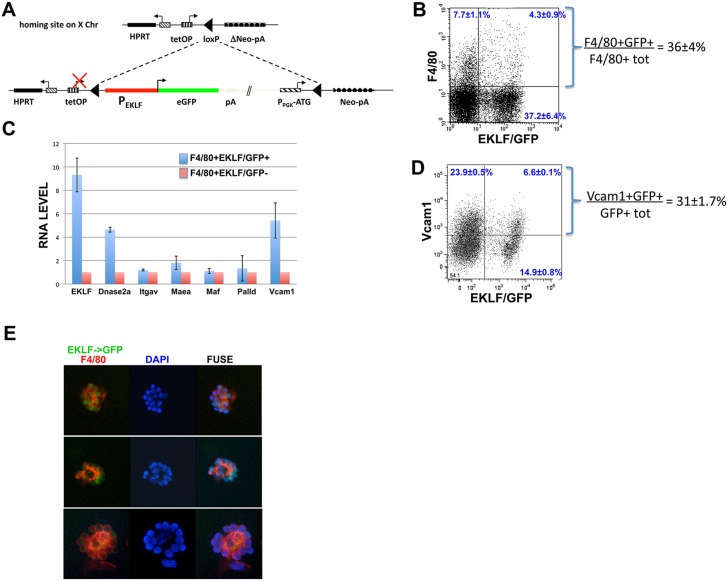
Fig. 5.
Analysis of the pEKLF/GFP mouse. (A) Schematic of the modified expression system (based on Kyba et al., 2002) after its unidirectional, single-copy integration into the single endogenous modified HPRT locus. The EKLF promoter (950 bp; red) is directly upstream of the GFP reporter (green) (Lohmann and Bieker, 2008). (B) FACS analysis of EKLF expression in macrophage. E13.5 fetal livers (n=8) from pEKLF/GFP mice (Lohmann and Bieker, 2008) were sorted for presence of macrophage (F4/80 marker) and EKLF-expressing cells (GFP marker). The percentage of double-positive F4/80 and GFP cells, compared to total F4/80+ cells, is indicated. (C) qRT-PCR analysis of macrophage genes important for erythroblastic island integrity. F4/80+ macrophage cells were FACS-sorted into EKLF/GFP+ or EKLF/GFP− singlet populations (as in supplementary material Fig. S3). RNA was isolated and used to analyze for the presence of the indicated transcripts. All values are normalized to GAPDH, and these values were then normalized to expression in F4/80+EKLF/GFP− cells (=‘1’). (D) FACS analysis of VCAM1 expression in EKLF-expressing cells (GFP marker) in E13.5 fetal livers from pEKLF/GFP mice (Lohmann and Bieker, 2008). The percentage of double-positive VCAM1 and GFP cells, compared to total GFP+ cells, is indicated. (E) Erythroblastic islands from E13.5 fetal livers were probed for F4/80 (red) and monitored for endogenous EKLF/GFP expression (green). Three typical islands are shown. DAPI (blue) was used as a nuclear marker.

