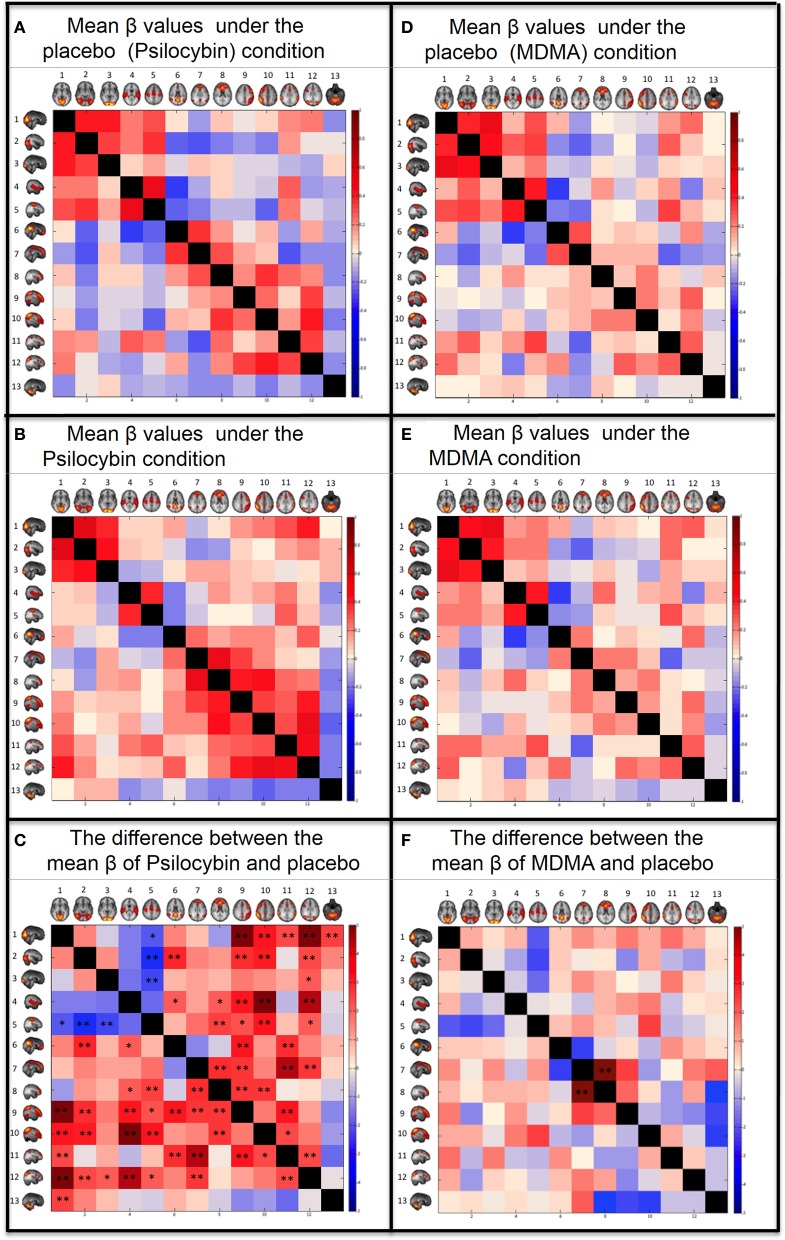
Figure 3.
Between networks resting state functional connectivity results. Within each matrix, each colored square represents coupling between corresponding RSN pairs with the color of the square denoting the coupling strength (A,B,D,E) or change in coupling strength (C,F) between the RSN pairs (blue, negative coupling or a decrease in coupling; red, positive coupling or an increase in coupling). The six images are: (A) Group mean of β values for the placebo of psilocybin condition. (B) Group mean of β values for the psilocybin condition. (C) Paired t-test (2-tail) for the difference between the mean β values of psilocybin and placebo. (D) Group mean of β values for the placebo of MDMA condition. (E) Group mean of β values for the MDMA condition. (F) Paired t-test (2-tail) for the difference between the mean β values of MDMA and placebo. The networks from Smith et al., (2009) are: (1) Visual—Medial (VisM), (2) Visual—Lateral (VisL), (3) Visual—Occipital pole (VisO), (4) Auditory (AUD), (5) Sensorimotor (SM), (6) Default Mode Network (DMN), (7) DMN2—A hybrid of anterior DMN and Executive Control Network, (8) Executive Control Network (ECN), (9) left Frontoparietal Network (lFP), (10) right Frontoparietal Network (rFP), (11) Dorsal Attention Network (DAN), (12) DAN2, (13) Cerebellum. FDR correction for multiple comparison (N = 78) was applied on the t-tests: *0.05 < q < 0.1. **q < 0.05.

