
Table 3.
Colors for each of the weekdays that were significantly different from expected values (in a chi-test), in the Dutch (D) English (E) and Hindi (H) speaking participant groups.
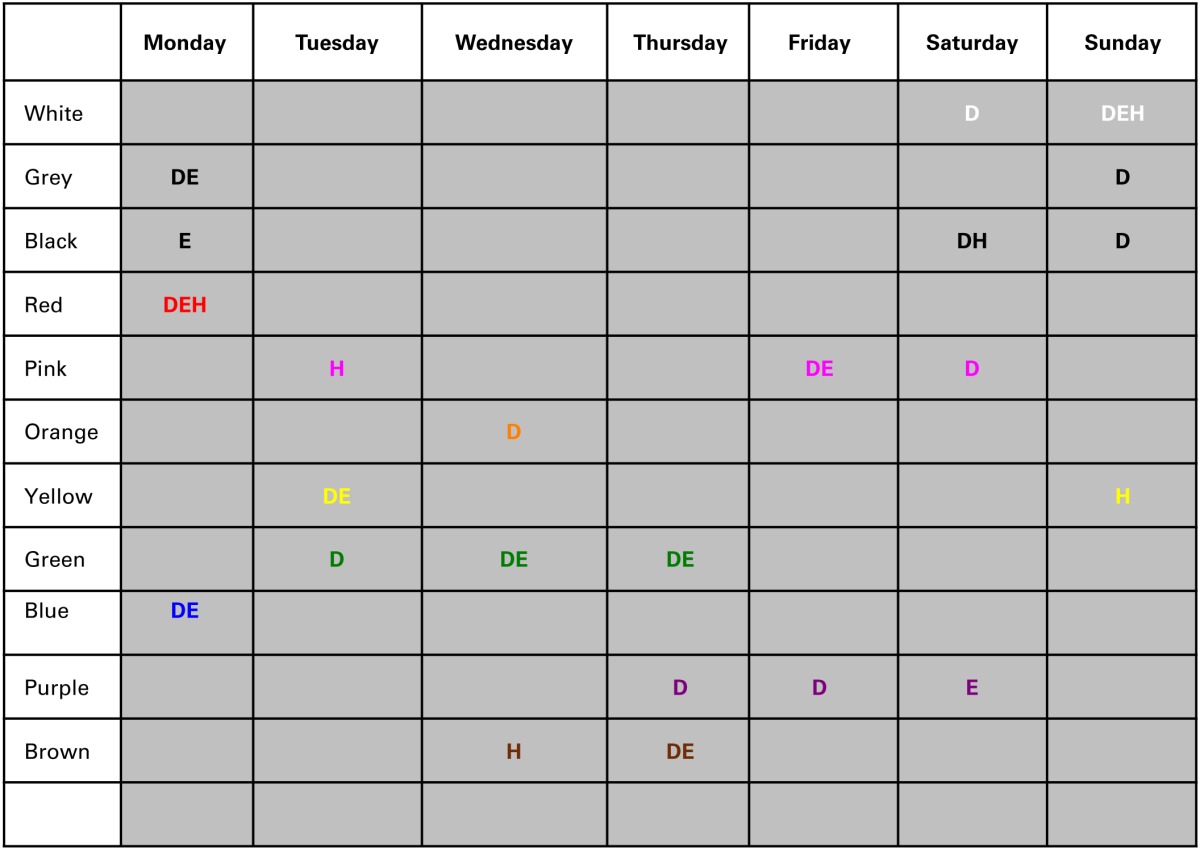
Expected valued is based on the percentage selection of each color in each language group.