Figure 10.

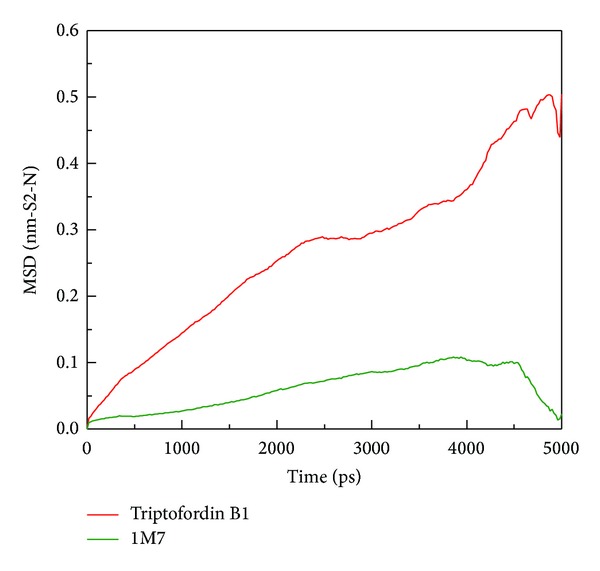
Mean square displacement (MSD) of different ligands during 5000 ps simulation times; the value of MSD indicates migration of ligands (Triptofordin B1 and 1M7) from initial site.

Mean square displacement (MSD) of different ligands during 5000 ps simulation times; the value of MSD indicates migration of ligands (Triptofordin B1 and 1M7) from initial site.