Figure 4.

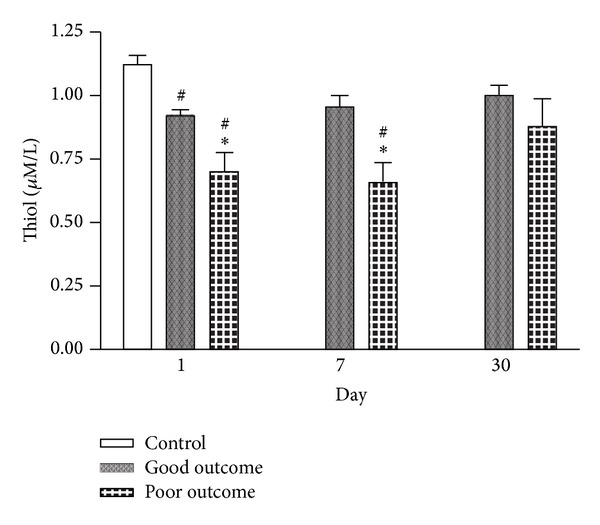
Serial changes in serum free thiol among patients with good and poor outcomes and in the controls at various time points after stroke. *P < 0.05 compared to the small vessel group; # P < 0.05 compared to the controls.

Serial changes in serum free thiol among patients with good and poor outcomes and in the controls at various time points after stroke. *P < 0.05 compared to the small vessel group; # P < 0.05 compared to the controls.