
Figure 5.
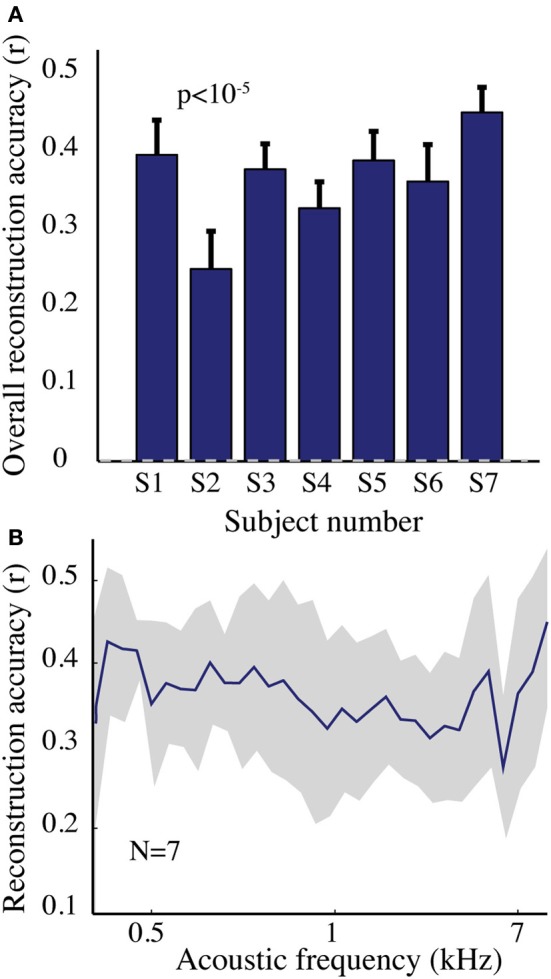
Overt speech reconstruction accuracy for the spectrogram-based speech representation. (A) Overall reconstruction accuracy for each subject using the spectrogram-based speech representation. Error bars denote standard error of the mean (s.e.m.). Overall accuracy is reported as the mean over all features (32 acoustic frequencies ranging from 0.2–7 kHz). The overall spectrogram reconstruction accuracy for the overt speech was greater than baseline control reconstruction accuracy in all individuals (p < 10−5; Hotelling's t-test). Baseline control reconstruction accuracy was not significantly different from zero (p > 0.1; one-sample t-test; gray dashed line) (B) Reconstruction accuracy as a function of acoustic frequency averaged over all subjects (N = 7) using the spectrogram model. Shaded region denotes s.e.m. over subjects.