
Figure 6.
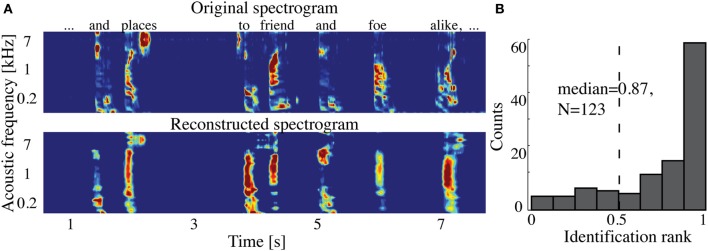
Overt speech reconstruction and identification. (A) Top panel: segment of the original sound spectrogram (subject's own voice), as well as the corresponding text above it. Bottom panel: same segment reconstructed with the decoding model. (B) Identification rank. Speech segments (5 s) were extracted from the continuous spectrogram. For each extracted segment (N = 123) a similarity score (correlation coefficient) was computed between the target reconstruction and each original spectrogram of the candidate set. The similarity scores were sorted and identification rank was quantified as the percentile rank of the correct segment. 1.0 indicates the target reconstruction matched the correct segment out of all candidate segments; 0.0 indicates the target was least similar to the correct segment among all other candidates; (dashed line indicates chance level = 0.5; median identification rank = 0.87; p < 10−5; randomization test).