
Figure 8.
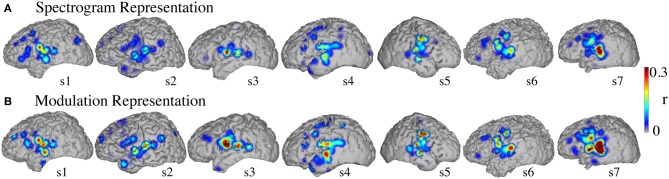
Overt speech informative areas. Reconstruction accuracy correlation coefficients were computed separately for each individual electrode and for both overt and baseline control conditions (see section Overt Speech: Informative areas for details). The plotted correlation values are calculated by subtracting the correlation during baseline control from the overt condition. The informative area map was thresholded to p < 0.05 (Bonferroni correction) (A) Spectrogram-based reconstruction accuracy (B) modulation-based reconstruction accuracy.