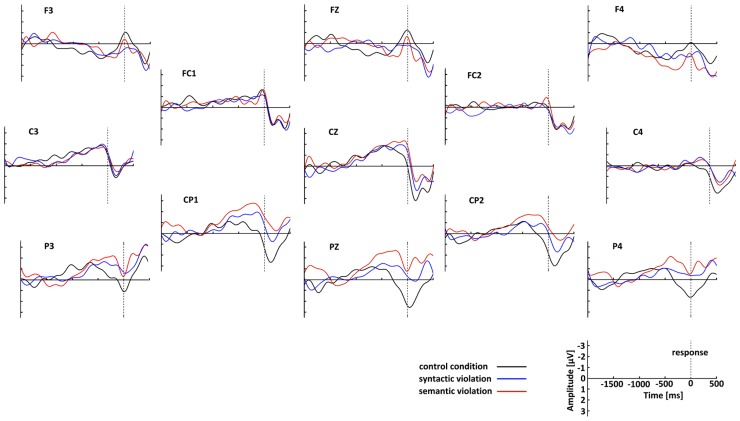
FIGURE 3.
Grand-average waveforms of the response-locked ERPs separately for the three conditions. The control condition is plotted in back, syntactic violations in blue, and semantic violations in red. The top of the figure corresponds to the anterior aspect of the head. The negative is plotted up.

