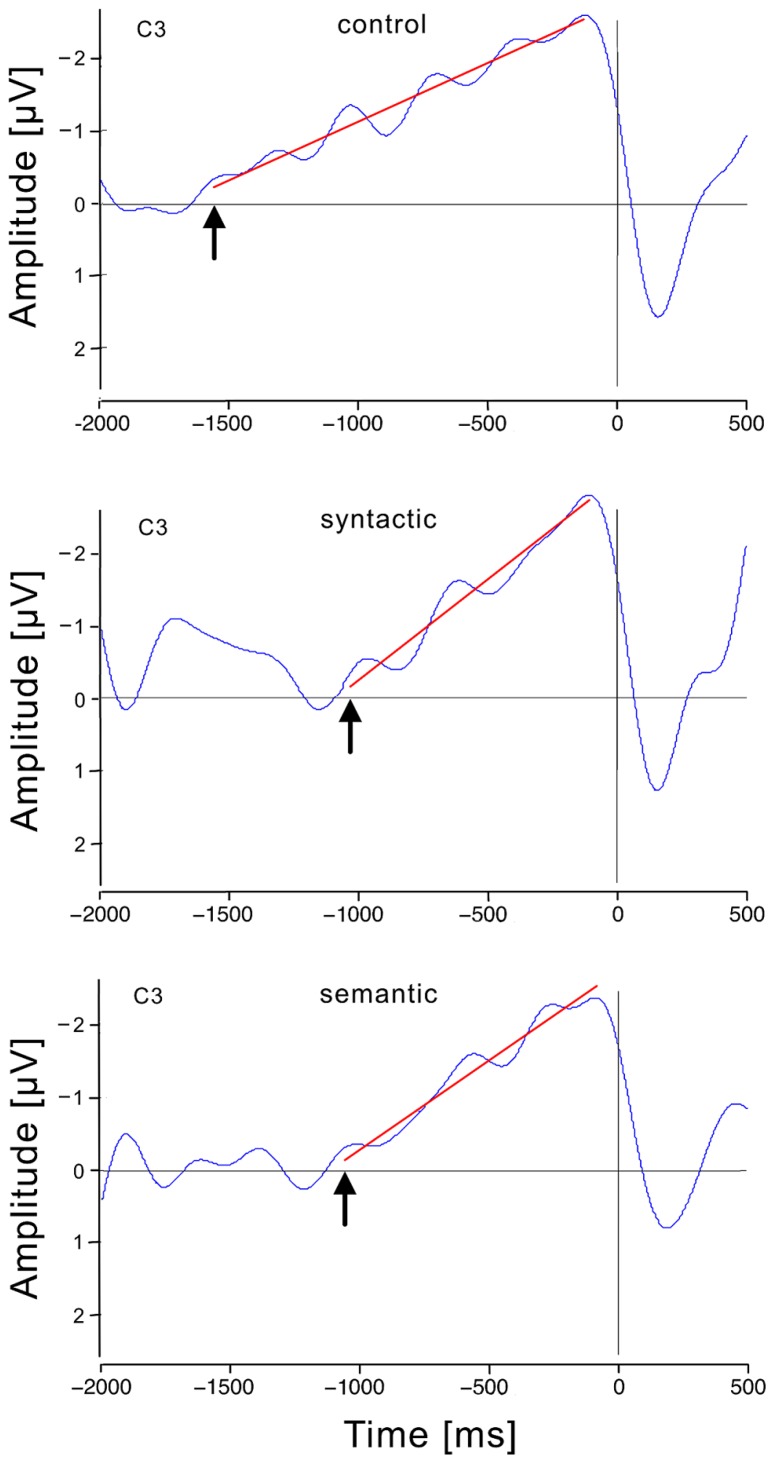
FIGURE 4.
Response-locked event-related brain potentials at the electrode position (C3) for each condition. Time 0 is the moment of the responses in this graph, which shows the smoothed RP (blue), and the regression line from the breaking point to the RP peak (red). The breaking points are indicated by arrows.

