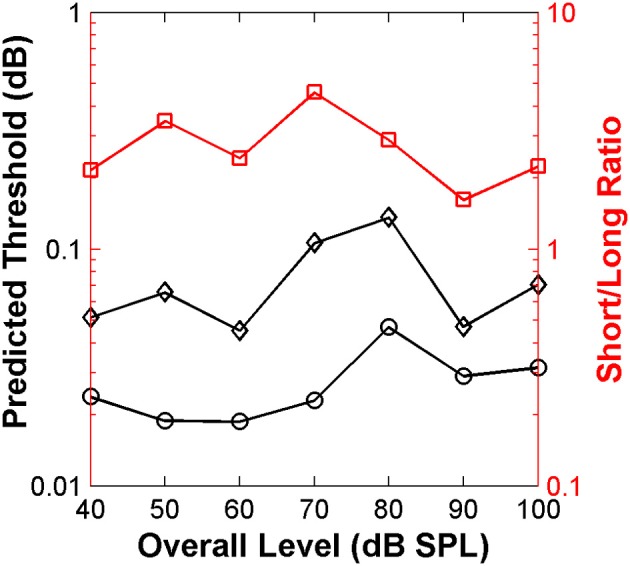
Figure 9.

Auditory nerve data: threshold notch depth vs. level functions predicted by an “ideal-observer” analysis of neural responses for noise bursts with different duration: 20 ms (diamonds) and 110 ms (circles). Red squares (right ordinate axis) illustrate the ratio between predicted thresholds for the long and short stimuli.
