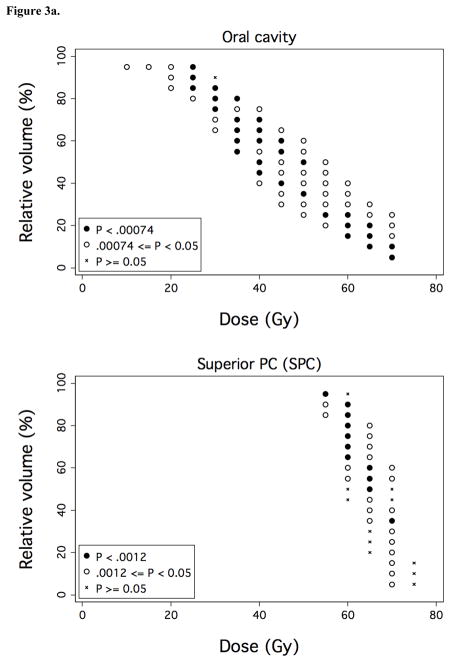
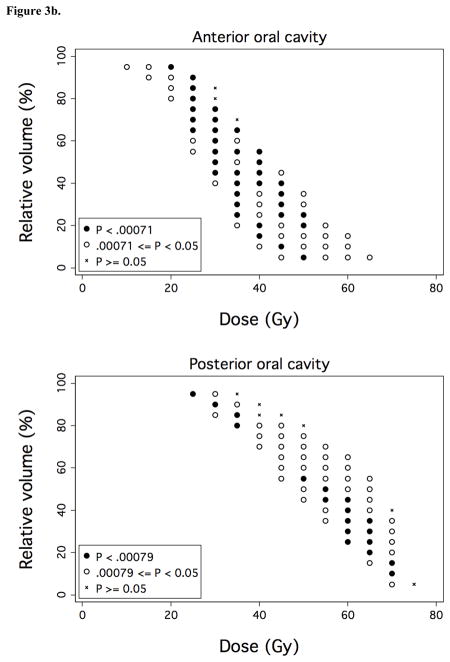
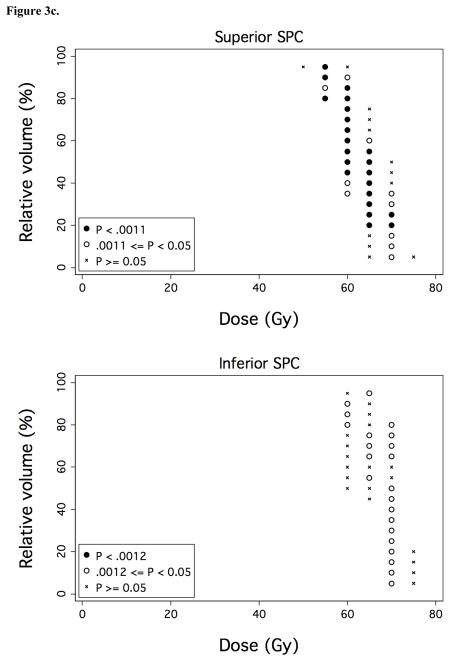
Figure 3. Associations between OAR dose-volume thresholds and OPSE outcomes.
Over a comprehensive range of dose (D) and relative volume (V%), normalized post-RT OPSE values were compared in the patient groups with VD > V% versus VD ≤ V%, where VD denotes the relative volume of the OAR exposed to doses > D Gy. Results are plotted as grid plots to indicate statistical significance of each dose-volume combination received by cohort patients. Dose-volume constraints significantly associated with OPSE outcomes following Bonferroni correction are designated by closed circles (●). a) Oral cavity and SPC. b) Anterior and posterior oral cavity subregion. c) Superior and inferior SPC subregion.


