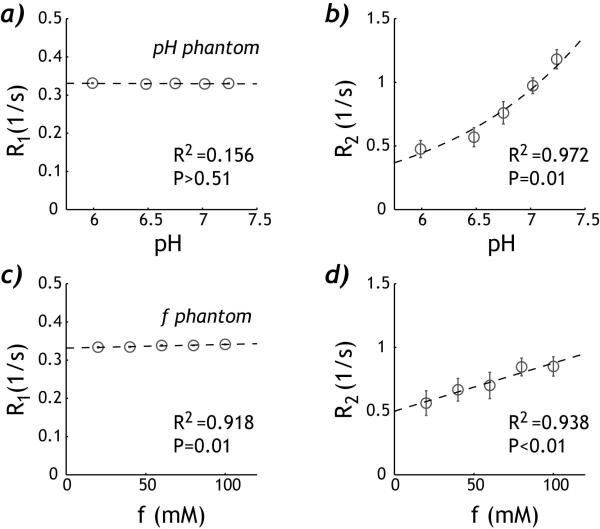
Fig. 2.
Relaxation measurements of the pH and concentration DIACEST phantoms. a) R1w for the pH phantom shows very little change with pH. b) R2w for the pH phantom increases exponentially with pH, suggesting base-catalyzed chemical exchange. c) R1w for the concentration phantom shows very little yet significant change with the creatine concentration. d) R2w of the concentration phantom increases approximately linearly with creatine concentration.

