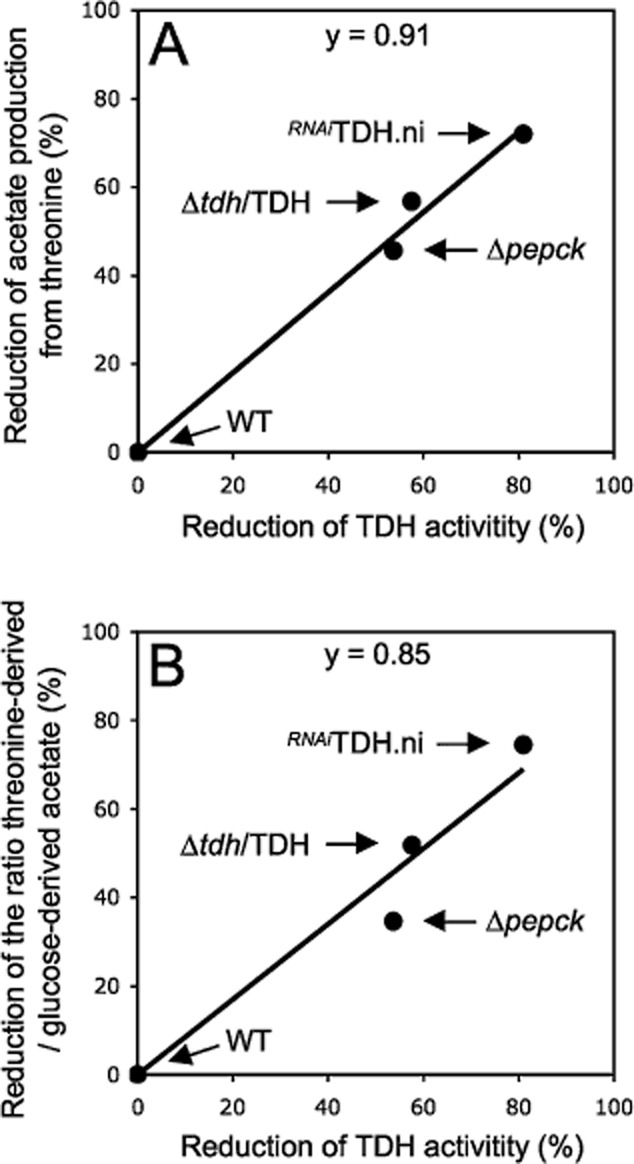
Figure 8.

Correlation between TDH activity and acetate production. These graphs show, the percentage of reduction of acetate production from threonine (panel A) and the percentage of reduction of the ratio between threonine-derived acetate and glucose-derived acetate (panel B), as a function of the TDH activity, in the Δpepck, Δtdh/TDH and RNAiTDH.ni mutants compared with the wild-type cells. The slope of the curves (y) is close to 1, suggesting a direct correlation between TDH activity and acetate production from threonine.
