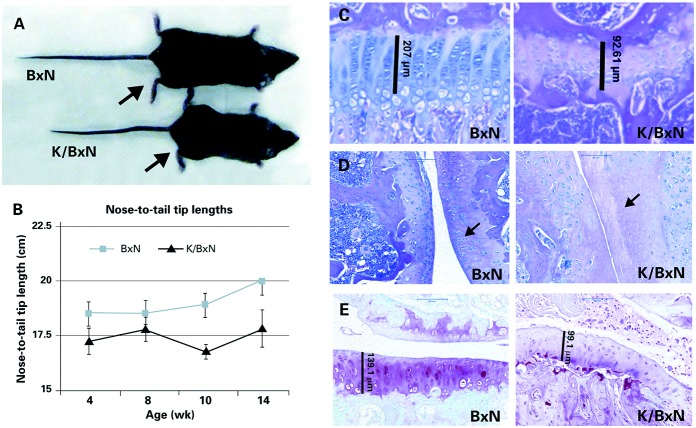
Figure 2.
Growth retardation and cartilage damage in K/BxN T cell receptor (TCR) mice. A, Photograph of 12-week-old female K/BxN mice with the TCR transgene (K/BxN TCR) and without the TCR transgene (BxN). Compared with the BxN mouse, the K/BxN TCR mouse is smaller and has evidence of inflammatory arthritis; the hind paw (arrows) is swollen in the K/BxN TCR mouse. B, Linear growth of male and female BxN and K/BxN TCR mice. Statistical analysis showed significant differences (P < 0.05 by F test) between BxN and K/BxN TCR mice at week 4 (n = 12 and n = 10, respectively), week 8 (n = 15 and n = 8, respectively), week 10 (n = 16 and n = 8, respectively), and week 14 (n = 14 and n = 5, respectively). Values are the mean ± SD. C, Photomicrographs of hematoxylin and eosin (H&E)–stained proximal tibia growth plate cartilage from a 9-week-old female K/BxN TCR mouse and a BxN littermate. The width of the growth plate is shown (vertical lines). Original magnification × 40. D, Photomicrographs of H&E-stained sagittal sections of the femorotibial joint of a 9-week-old female BxN mouse and a K/BxN TCR littermate. Bars = 100 μm. E, Photomicrographs of Safranin O–stained coronal sections of the femorotibial joint of a 12-week-old female BxN mouse and a K/BxN TCR littermate. Bars = 100 μm. K/BxN TCR mice exhibited cartilage thinning (vertical lines in C and D), chondrocyte loss (arrows in D), and reduced proteoglycan content compared to BxN mice.

