
Figure 3.
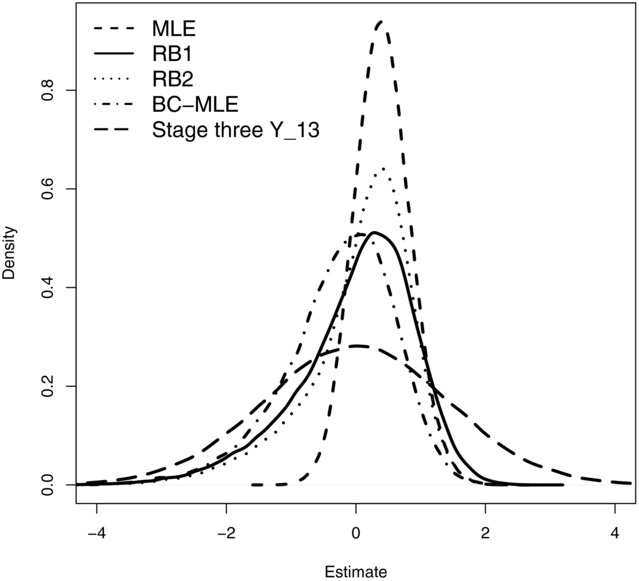
Distribution of the 5 estimators' estimates for  from a three-stage 3:2:1 drop-the-losers design, given stage-wise variances
  =
=  . Each distribution is based on 100,000 simulations.
Official websites use .gov
A
.gov website belongs to an official
government organization in the United States.
Secure .gov websites use HTTPS
A lock (
) or https:// means you've safely
connected to the .gov website. Share sensitive
information only on official, secure websites.
Distribution of the 5 estimators' estimates for from a three-stage 3:2:1 drop-the-losers design, given stage-wise variances = . Each distribution is based on 100,000 simulations.