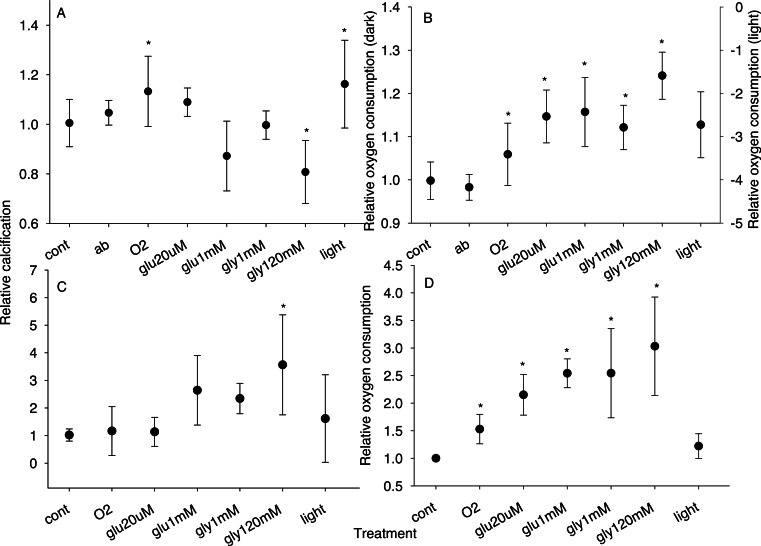
Figure 2. Relative calcification and respiration rates.
Relative calcification (A, C) and respiration (B, D) rates for zooxanthellate (A, B) and bleached (C, D) microcolonies maintained under each treatment condition. Treatments were: cont, control; ab, antibiotics; O2, ∼2× atmospheric pO2; glu20µm, ∼20 µM glucose with oxygen; glu1mm, ∼1 mM glucose with oxygen; gly1mm, ∼1 mM glycerol with oxygen; gly120mM, 120 mM glycerol with oxygen; light, light. With the exception of the light treatment, all incubations were conducted in the dark. N = 4 or greater for all treatments; symbols are mean; error bars are standard deviation; ∗, treatment significantly different from control at p = 0.05.

