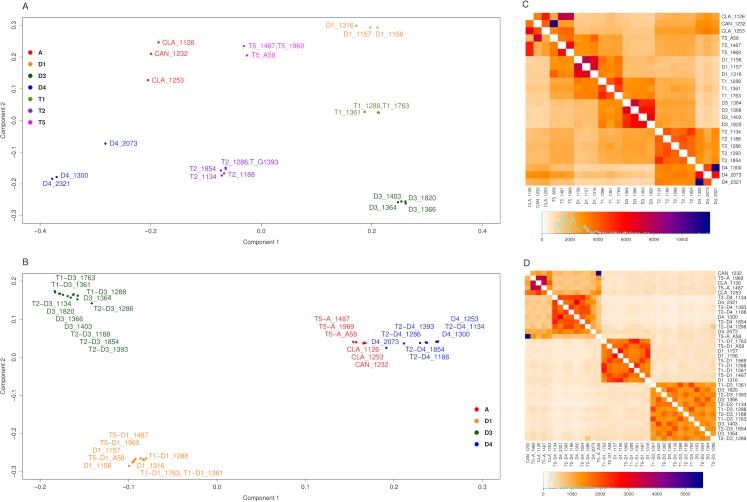
Figure 4. FineStructure analysis for Glycine perennial polyploid species.
Analysis using FineStructure for (A, C) 220,952 SNPs for the Glycine perennial polyploid complex (species groups A, D1, D3, D4, T1, T2 and T5) without homoeologue separation. 7 clusters can be distinguished (one per species group) in the PCA analysis where polyploids are admixtures of the diploid progenitor groups (A). The heatmap (C) shows diploid hybrid signal for polyploids, for example T5_A58 shows a stronger signal with its progenitors: CAN_1232 (blue) and D1_1316 (intense orange). (B, D) 70,910 SNPs for the Glycine perennial polyploid complex after homoeologue separation. 3 clusters can be distinguished in the PCA analysis (B): right cluster, species from the A-genome (A and D4); bottom-left cluster, species D1; and top-left cluster, species D3. (D) The heatmap signal is divided into the same three major clusters.

