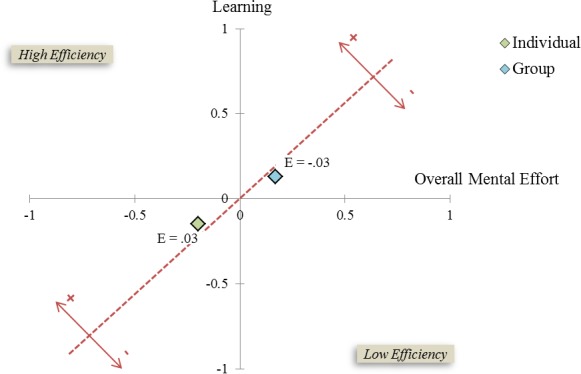
Figure 4. Instructional efficiency graph for the training system as experienced by individuals and groups.

The x-axis represents mean overall mental effort. The y-axis represents performance. The gray dotted line reflects the midline for efficiency, such that efficiency scores to the left of this line indicate high instructional efficiency and scores to the right of this line indicate low instructional efficiency.
