
Figure 3.
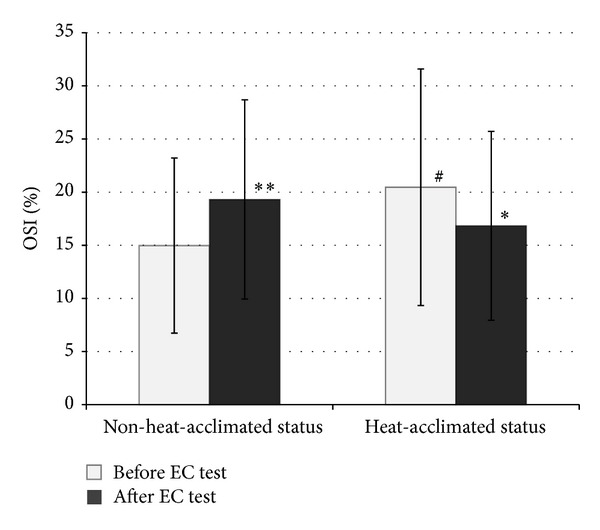
The values of oxidative stress index before and after the endurance capacity test in the heat measured before and after heat acclimation program (x ± SD). EC: endurance capacity; OSI: oxidative stress index; *P < 0.05; **P < 0.01 as compared to value measured before EC test in heat-acclimated status/non-heat-acclimated status; # P < 0.05 as compared to non-heat-acclimated status before EC test; main effect (F): 3.79; P value: 0.015.