
Figure 5.
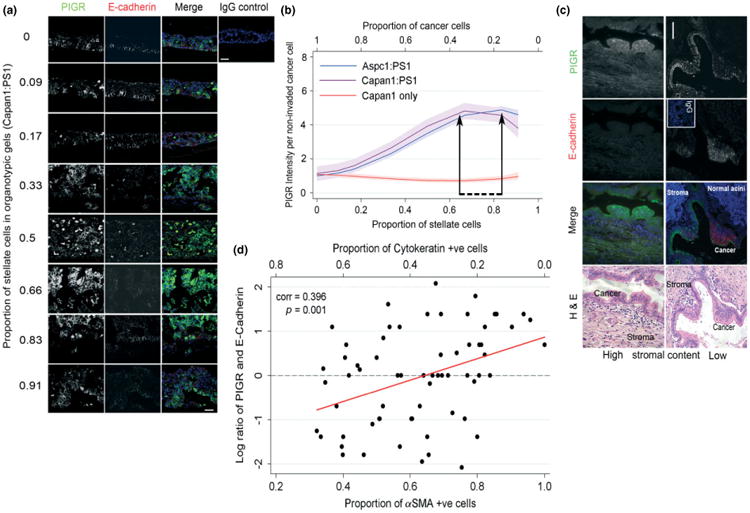
Confirmation of changes in protein expression in organotypic cultures and human tissue samples. Intense PIGR staining was noted in cancer cells when the stellate cell proportion was 0.66–0.83, which correlated inversely to expression of E-cadherin (a) in organotypic cultures; fractional polynomial regression lines (bold), along with 95% confidence intervals (shaded areas) of PIGR staining intensity (b). Inverse relation of E-cadherin expression to PIGR expression and the stromal context in vivo in human PDAC (c), validating the observations made in the physiomimetic in vitro organotypic cultures; scale bar = 100 μm. Scatter plot with fitted trend line shows a significant positive correlation between PIGR:E-cadherin staining and the proportion of stellate cells (d). Log-transformed PIGR:E-cadherin ratio was used.