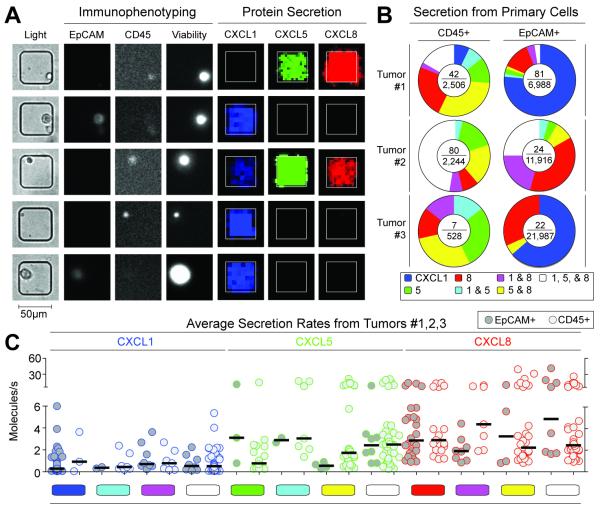
Fig. 1. Immunophenotyping and secretion of chemokines by human primary colorectal tumor cells.
(A) Micrographs comprising transmitted light and epifluoresence images of single cells from a disaggregated tumor measured by microscopy and their secretory state measured by microengraving. (B) Pie charts of the distribution of secretion states from three human primary colorectal tumor samples (#1-3) measured two days post surgery. The center of each pie chart shows the number of observed single-cell secretion events over the total number of live CD45+ or EpCAM+ single cells, respectively. (C) Scatter plots of rates of secretion for chemokines released by single, live CD45+ leukocytes and EpCAM+ tumor cells classified by observed secretory state. Limits of detection for 4 h assays were ~0.1 molecules/s. Color-coded bars indicate the same combinations noted in Fig. 1b. The fraction of secreting leukocytes detected was higher than the tumor cells in tumor #2 (p<0.0001) and in tumor #3 (p<0.0001), but no statistically-significant differences were observed for tumor #1.

