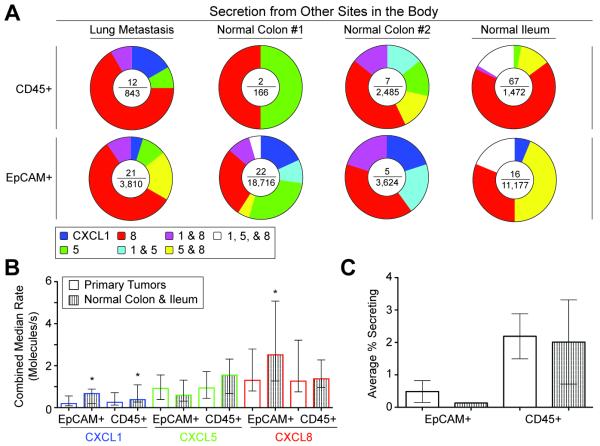
Fig. 2. Secretion of chemokines from other sites of the body.
(A) Pie charts of the distributions of secretory states observed from single cells of a lung metastasis, two normal colon samples, and normal ileum epithelium, measured two days post surgery. The center of each pie chart depicts the number of single-cell secretion events over the total number of live single cells. (B) Bargraph of the combined median rates of secretions of CXCL1, 5, and 8 for EpCAM+ and CD45+ cells from both normal colon and ileum and human primary colorectal tumors. EpCAM+ cells of normal tissue had higher median secretion rates of CXCL1 and CXCL8 than those of tumor tissue (p<0.05). CD45+ cells of normal tissue secreted higher median levels of CXCL1 than those of tumor tissue (p<0.05). Error bars indicate interquartile range. (C) Bargraph of percentages of EpCAM+ and CD45+ cells with measured secretions of CXCL1, 5, and 8. Error bars indicate s.e.m.

