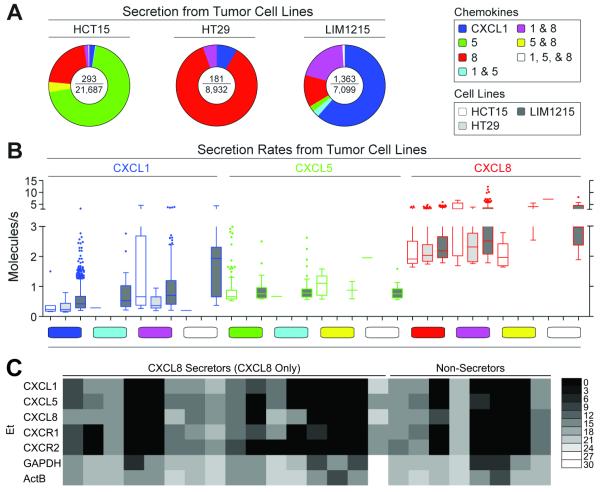
Fig. 4. Single-cell production of chemokines by tumor cell lines.
(A) Pie charts of the distribution of secretory states observed from single cells of three colon cancer cell lines assayed for 2 h by microengraving. The center of each pie chart depicts the number of single-cell secretion events over the total number of live single cells. (B) Scatter plots of the rates of secretion of chemokines measured for live single cells, and classified according to secretory state, from the three colon cancer cell lines. Limits of detection for 2 h assays were approximately 0.2 molecules/s. (C) Single-cell gene expression measured by qRT-PCR for HT29 cells selected based on secretory state following microengraving for 2 h for CXCL8. Ct values were converted to Et values as described in Methods.35

