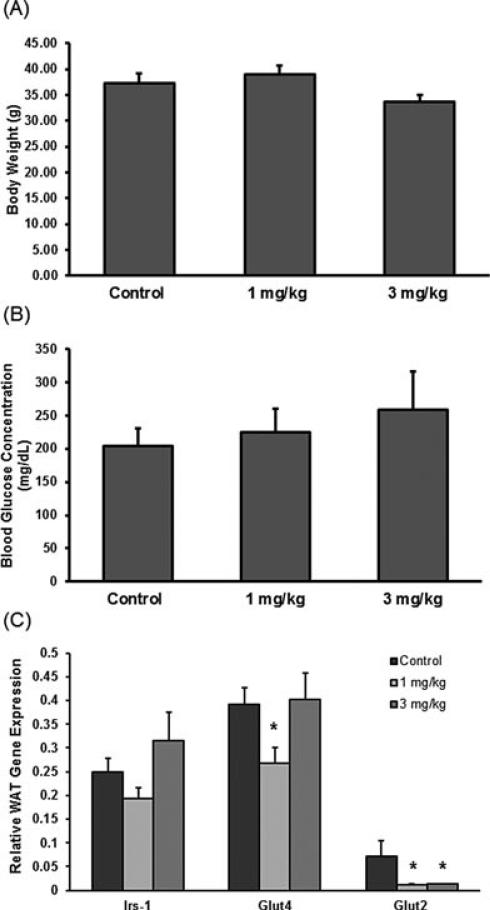
FIGURE 1.
Body weight was used to describe any potential metabolic effects of perinatal deltamethrin exposure, along with blood glucose concentration and mRNA gene expression of key factors in insulin response of WAT to describe potential effects on glucose homeostasis. Body weights of 5-month-old male mice were taken prior to sacrifice. (A) Average body weight (g) of each treatment group expressed as a mean BW ± SEM (n =6–7). (B) Blood glucose level taken at time of necropsy of 5-month-old adult male mice expressed as a mean BG ± SEM (n = 5–6–). mRNA gene expression data in WAT of 5-month-old adult male mouse pups from dams exposed to 0,1, or3 mg deltamethrin/kg every 3 days during getation and lactation. Total RNA was isolated from WAT, and mRNA levels were Quantified by Quantigene Plex 2.0 assay. All gene expression data were normalized to Rpl13a (no significant change in gene expression) and are expressed as mean ± SEM (n = 8–9). (C) Insulin responsive and glucose transport: Irs-1, Glut-4, Glut- 2 mRNA expression. mRNA gene expression data in WAT of 5-month-old adult male mouse pups from dams exposed to 0, 1, or 3 mg deltamethrin/kg every 3 days during gestation and lactation. * and # represent statistical difference between control and treatment doses (p < 0.05 and p < 0.005, respectively).

