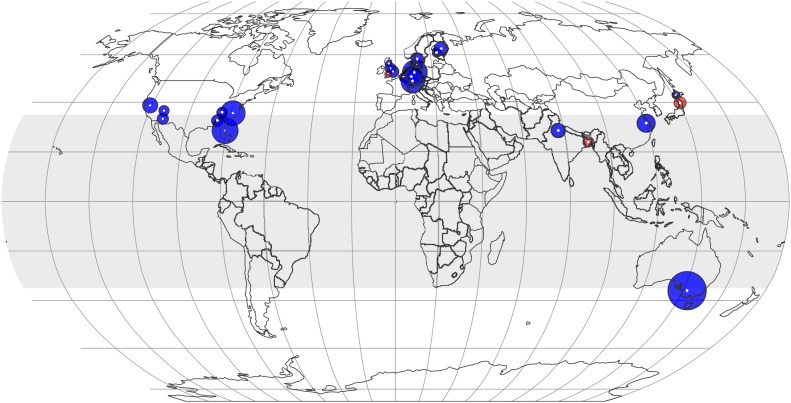
Figure 7. The effect of CO2 at various locations and latitudes.
Locations of the FACE and Open Top Chamber (OTC) centers, which report concentrations of minerals in foliar or edible tissues, are shown as white dots inside colored circles. The area of a circle is proportional to the total number of observations (counting replicates) generated by the center. If the mean change is negative (decline in mineral content), the respective circle is blue; otherwise, it is red. The figure reflects data on 21 minerals in 57 plant species and cultivars. The shaded region (between 35 N and S latitudes) represents tropics and subtropics.

