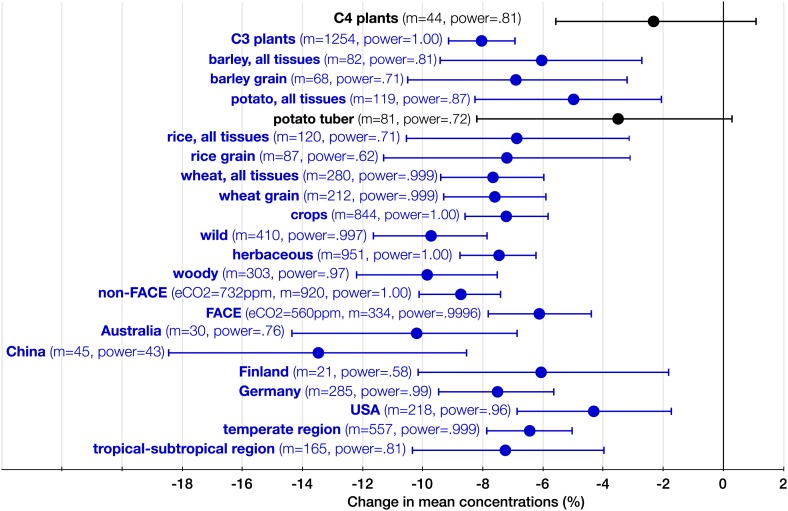
Figure 8. The systemic aspect of the CO2 effect.
Change (%) in the mean concentration of minerals in plants grown in eCO2 relative to those grown at ambient levels. All the results in the figure reflect the combined data for the foliar and the edible tissues. The number of total mean observations (m) for all the measured minerals across all the studies for each crop/plant group, experiment type, country, or region is shown with the respective statistical power. Country specific and regional results reflect all the FACE and Open Top Chamber (OTC) studies carried in any given country/region. The number of total observations (with replicates) for all the minerals (not counting C and N) for each country is as follows: Australia (926), China (193), Finland (144), Germany (908), and USA (1156). Other details are in the legends for Figures 2 and 3.

