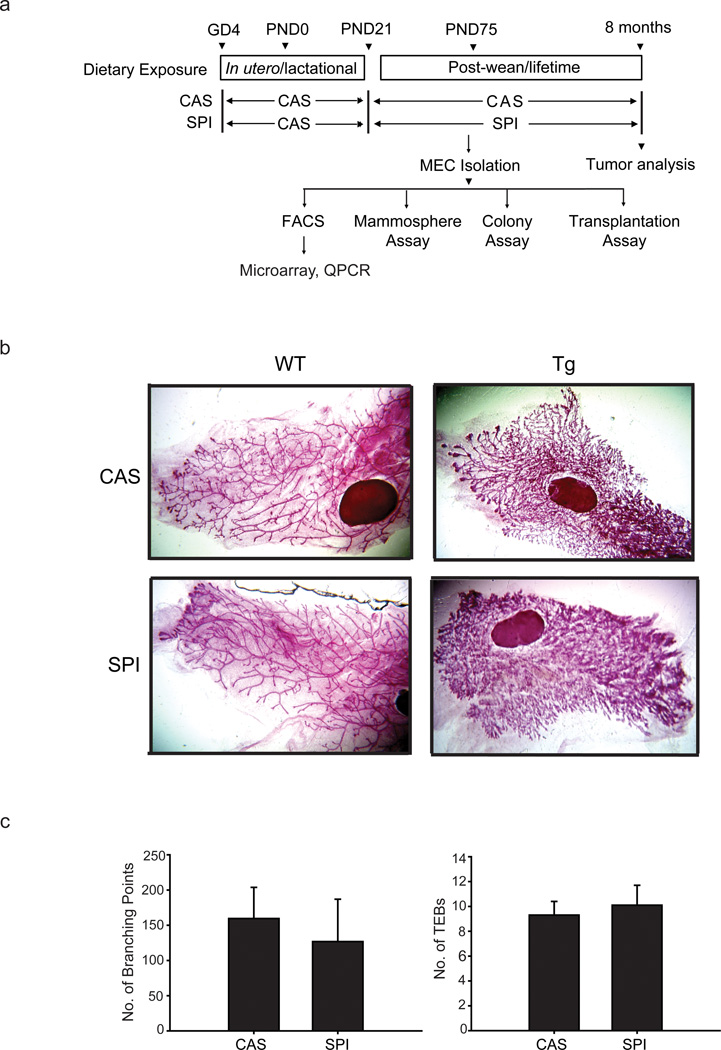
Figure 1.
Description of the animal model and experimental design. (a) Overview of the dietary regimen and subsequent analyses. Wildtype female mice were mated with Wnt1-Transgenic (Tg) males to generate wildtype and Wnt-1 Tg offspring. Female Wnt1-Tg mice at weaning [postnatal day (PND) 21] were randomly assigned to either casein (CAS) or soy protein isolate (SPI) diets and were fed their respective diets thereafter. Mice (n=30 mice per diet group) were followed for mammary tumor appearance (by palpation), and those with tumors were sacrificed two weeks after initial tumor appearance. Mice that did not develop tumors were sacrificed at 8 months of age. A similar set of mice were sacrificed at postnatal day (PND) 75 for the conduct of the various assays shown. Abbreviations used: GD4, gestation day 4; MEC, mammary epithelial cells; FACS, fluorescence-activated cell sorting; QPCR, quantitative real-time polymerase chain reaction. (b) Representative carmine-stained whole mounts of mammary glands (left mammary gland #4) from Wnt1-Tg females and their wildtype (WT) siblings of the two diet groups. Wnt1-Tg and WT mice were fed either CAS or SPI diet beginning at PND21 (weaning) and mammary tissues at PND50 were collected for the analyses, following previously described procedures (Rahal et al., 2013). (c) Mammary ductal branching and terminal end buds (TEBs) were quantified in PND50 Wnt1-Tg mice of the two diet groups. Branching density for each gland was quantified by counting the number of branched points within a box of fixed dimensions. The TEBs located at the leading edge of the fat pad were counted from whole mounts of the left mammary gland #4. Results are mean ± SEM (n=5 and 4 individual mice, respectively for CAS and SPI diets).

