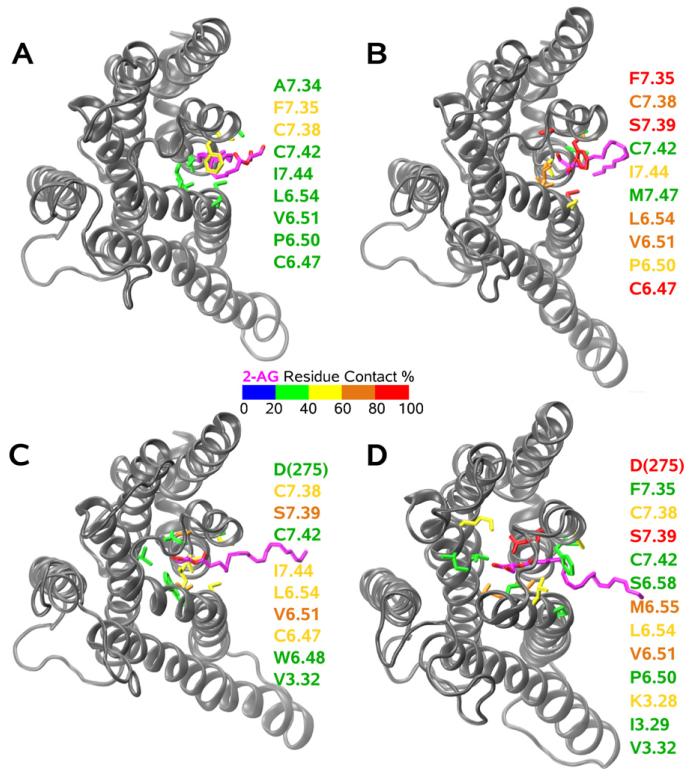
Fig. 7.
This figure illustrates the progress of 2-AG into the CB2 binding pocket. The color scale represents the percentage of the trajectory in which any portion of 2-AG is within 4Å of residues on CB2 (defined here as within contact distance). Residues within contact distance are listed on the right and are color coded according to this scale. The view is from the extracellular side of the receptor. (A) 2-AG has partitioned out of bulk lipid and contacts residues in or near the TMH6/7 interface. Highest contact is with F7.35(281) and C7.38(284). (B) 2-AG interaction with residues in the TMH6/7 interface increases with greater than 80% contact ocurring with F7.35(281), S7.39(285) and C6.47(257). (C) 2-AG begins to contact binding pocket residues on TMH3 (V3.32(113)), TMH6 (W6.48(258)), TMH7 (C7.42(288)) and the EC-3 loop (D(275)). (D) Subsequent to protonation, 2-AG contacts multiple residues on TMH3/6/7 and the EC-3 loop with formation of hydrogen bonds with D(275) in the EC-3 loop and to a lesser extent with S7.39(285) (Hurst et al., 2010).

