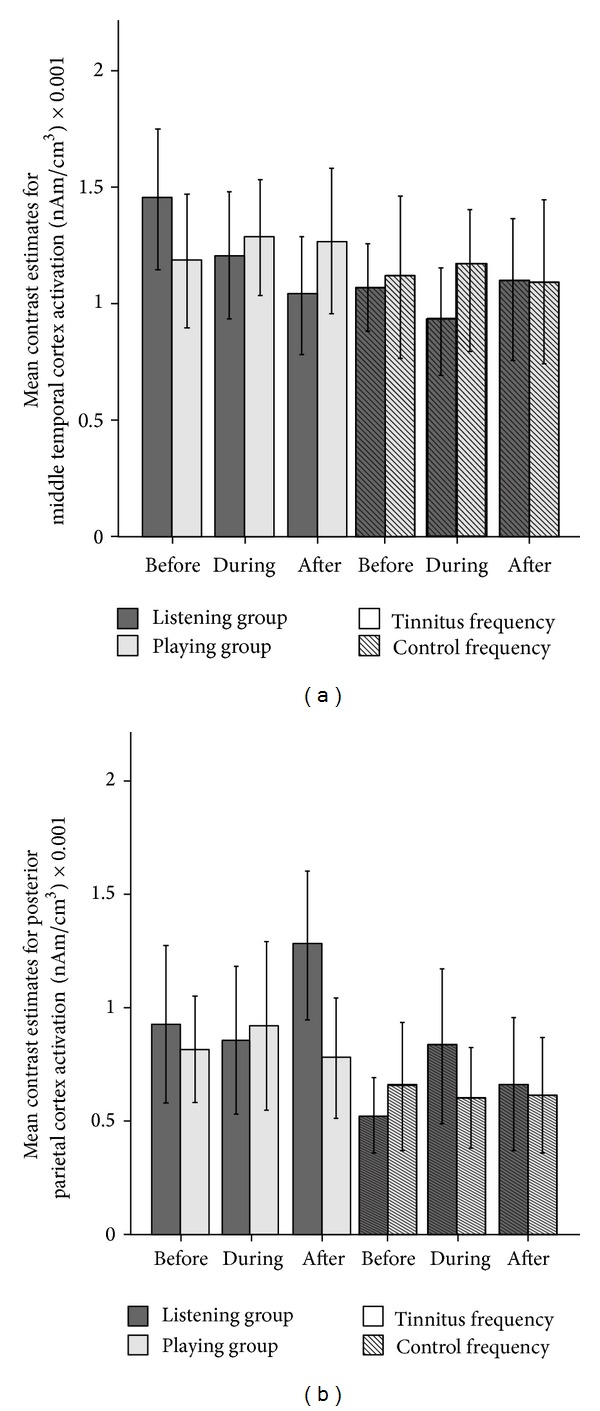
Figure 5.

Mean contrast estimates for (a) the middle temporal cortex and (b) posterior parietal cortex before, during, and after the treatment. The solid dark grey bars indicate the contrast estimates of the listening group while the solid light grey indicates the activations of the playing group for the tinnitus frequency. The dark grey bars marked with lines indicate the contrast estimates of the listening group for the control frequency. The light grey bars marked with lines indicate the contrast estimates of the playing group for the control frequency. The treatment caused a gradual decrease of the activation of the middle temporal cortex and an increase in the activation of the posterior parietal cortex in the tinnitus frequency of the listening group. Error bars: 2 × standard error of mean.
