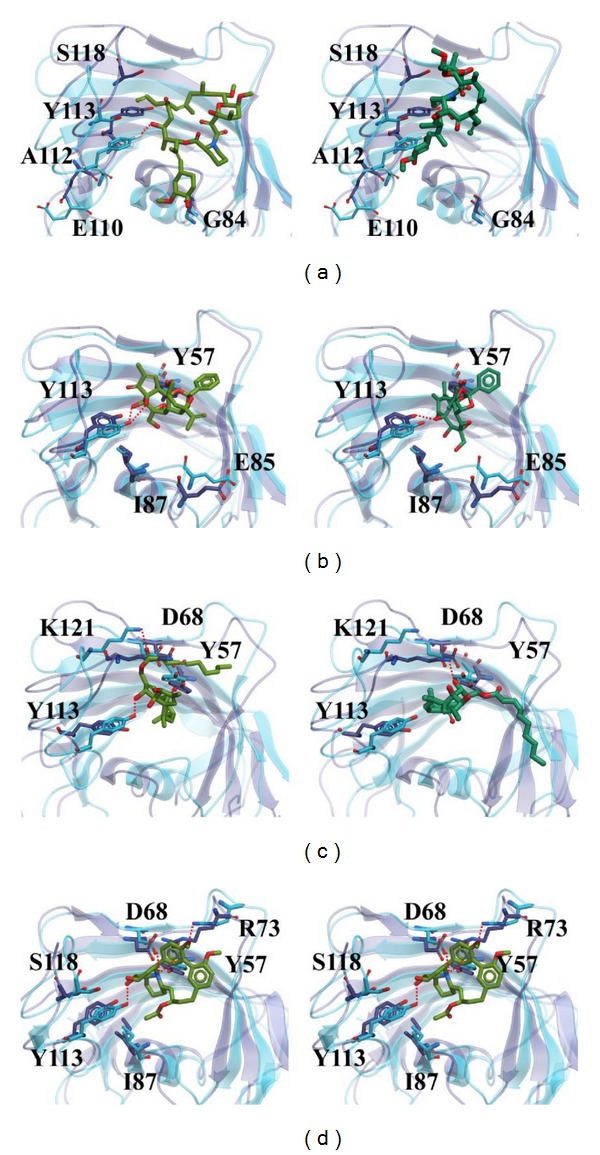
Figure 11.

The conformation of protein-ligand complex at 0 ns of MD simulation on the left side compared to the conformation at specific time of MD simulation on the right side. The conformations of (a) Tacrolimus, (b) Daphnetoxin, (c) 20-O-(2′E,4′E-decadienoyl)ingenol, and (d) Lythrancine II are at 19.02 ns, 19.32 ns, 19.58 ns, and 19.72 ns during MD simulation, respectively. The protein structure and residues shown in blue and the ligand shown in light green indicate the conformation at 0 ns. On the other hand, the protein structure and residues shown in violet and the ligand shown in deep green indicate the conformation at specific time of MD simulation.
