Figure 3.
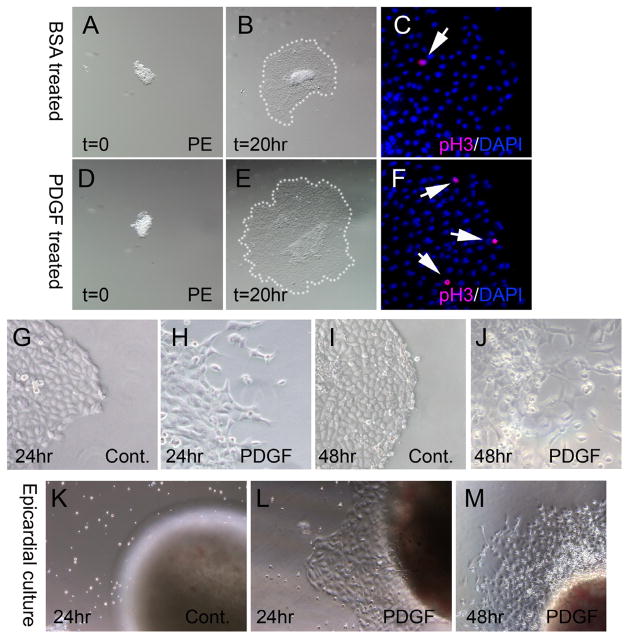
Mitogen induced behavioral changes of PE and epicardial cultures. (A–C) BSA control treated and (D–F) 10 ng/ml PDGF-treated PE cultures. (A,D) PE explants at 0 hours of culture showing similar size of explanted tissue. (B) Control PE after 20 hours culture compared to (E) PDGF-treated PE after 20 hours showing greater spread area indicated with white dots. (C,F) Phospho-Histone H3 (pink) and DAPI (blue) detection showing greater cell proliferation in (F) PDGF-treated vs (C) control samples. (G) 24 hour cultured control PE. (H) 24 hour cultured PDGF-treated PE showing mesenchymal cells at periphery of explant. (I) 48 hour cultured control PE. (J) 48 hour cultured PDGF-treated PE showing many mesenchymal cells. (K–M) Epicardial cultures of E13.5 heart fragments. (K) 24 hour cultured control heart showing an absence of spreading epicardium. (L) 24 hour PDGF-treated heart showing epicardial spreading without mesenchymal cells at periphery. (M) 48 hour PDGF-treated heart showing epicardial spreading and a few mesenchymal cells at the periphery.

