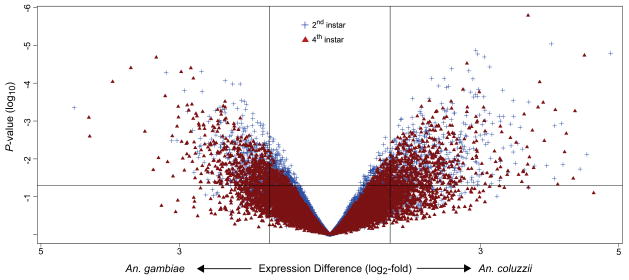
Figure 3.
Volcano plot displaying gene expression differences (log2-fold change) between untreated larval samples of An. coluzzii and An. gambiae. Each symbol represents one gene that had detectable expression in either species, in samples of 2nd instar larvae (blue cross) or 4th instar larvae (red triangle). Relative differences in signal intensity along the X-axis reflect up-regulation in An. coluzzii when positive, and up-regulation in An. gambiae when negative; vertical lines indicate the log2-fold-change cut-off of +/−1.8. The Y-axis displays log10-transformed P-values associated with Bayes-moderated t-tests of differential gene expression; the horizontal line indicates the 0.05 threshold level for significance.

