
Figure 6.
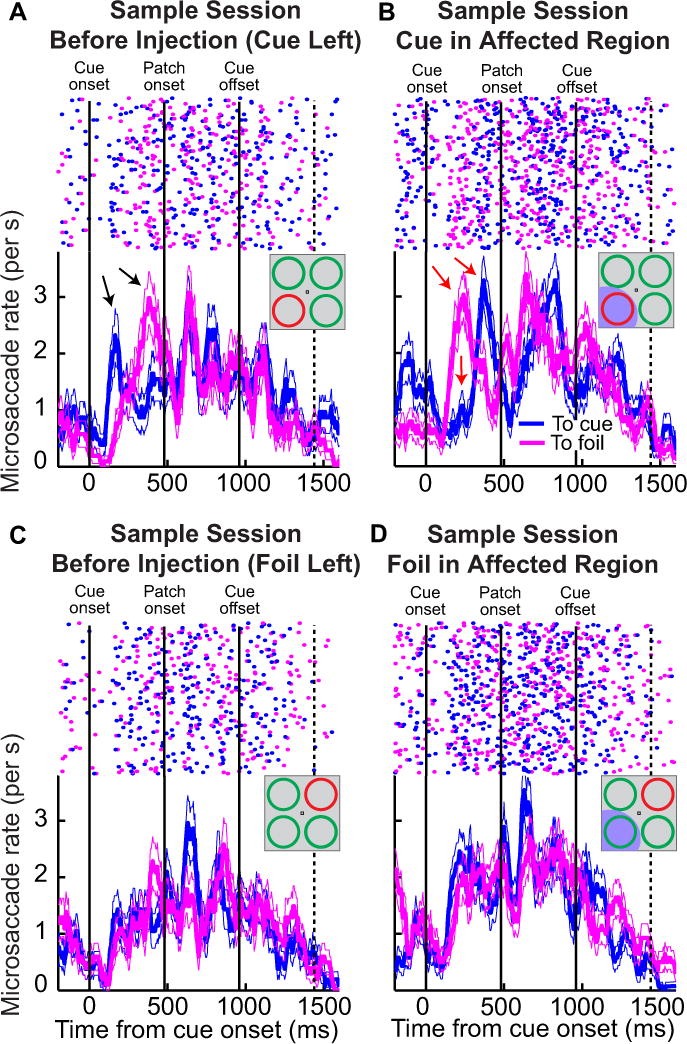
A demonstration of how SC inactivation altered microsaccade directional distributions in the covert attention task without necessarily altering microsaccade rate. For the same sample experiment of Fig. 3, we plotted in the bottom panels microsaccade rate as a function of time from cue onset (as in Fig. 3). However, in this figure, we separated movements as either being directed toward the cue (blue) or being directed toward the foil (magenta). To reduce clutter, we did not plot microsaccade rate for movements directed toward the other two quadrants (but see Figs. 8–10 for summaries of these). In the top panels, we show raster plots where each dot indicates the onset time of a microsaccade (x-axis) in a given trial (sorted on the y-axis). (A) Pre-injection data before SC inactivation of the lower left quadrant, and with the cue placed in the same quadrant. Cue onset induced a strong bias in microsaccade direction toward the cue followed by a bias in the opposite direction (black arrows). (B) During inactivation of the cued location, microsaccades after cue onset were biased away from the cued location (red arrows). Thus, even though microsaccades occurred at similar rates before and during inactivation (Fig. 3), the directional influence of the cue onset on microsaccades during inactivation was removed and there was instead a bias in favor of the opposite unaffected location. (C) With the foil in the region soon to be affected by SC inactivation, and the cue outside, pre-injection data showed that cue onset induced microsaccades in the direction of both cue and foil. This could reflect idiosyncracies for this particular visual quadrant compared to the stimulus configuration of A. (D) Importantly, this pattern was unaltered after SC inactivation with the foil in the affected region (i.e. the large directional redistribution seen in B relative to before injection was not present). Most notably, the blue curve shows that the cue, when it was in an unaffected region of space, was still effective in inducing microsaccades toward its location. Error bars denote s.e.m.