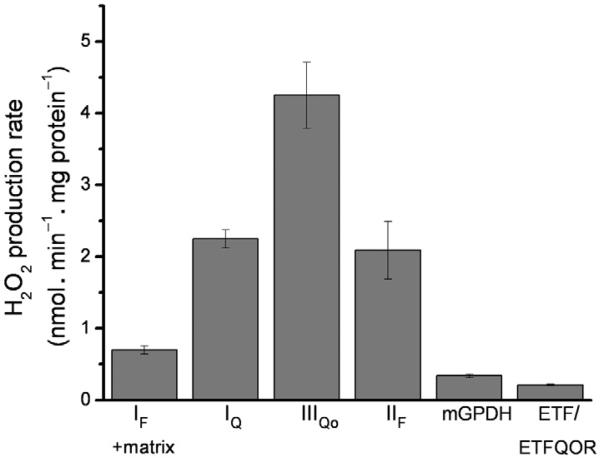
Figure 12.4.
Maximum rates of superoxide/H2O2 production from different mitochondrial sites. Data were corrected for H2O2 consumption by matrix peroxidases using the CDNB protocol described in Section 2.4. In all cases, measurements were made under the conditions that we have found to maximize superoxide production rates from these sites, as described in Section 3. The rate from the complex I flavin site includes any other matrix sites that may respond to NADH reduction and is therefore referred to as IF+matrix. Data for this graph are means±SEM (n≥3) and were compiled from Orr et al. (2012), Perevoshchikova et al. (2013), Quinlan et al. (2011), Quinlan, Orr, et al. (2012), and Treberg et al. (2010).

