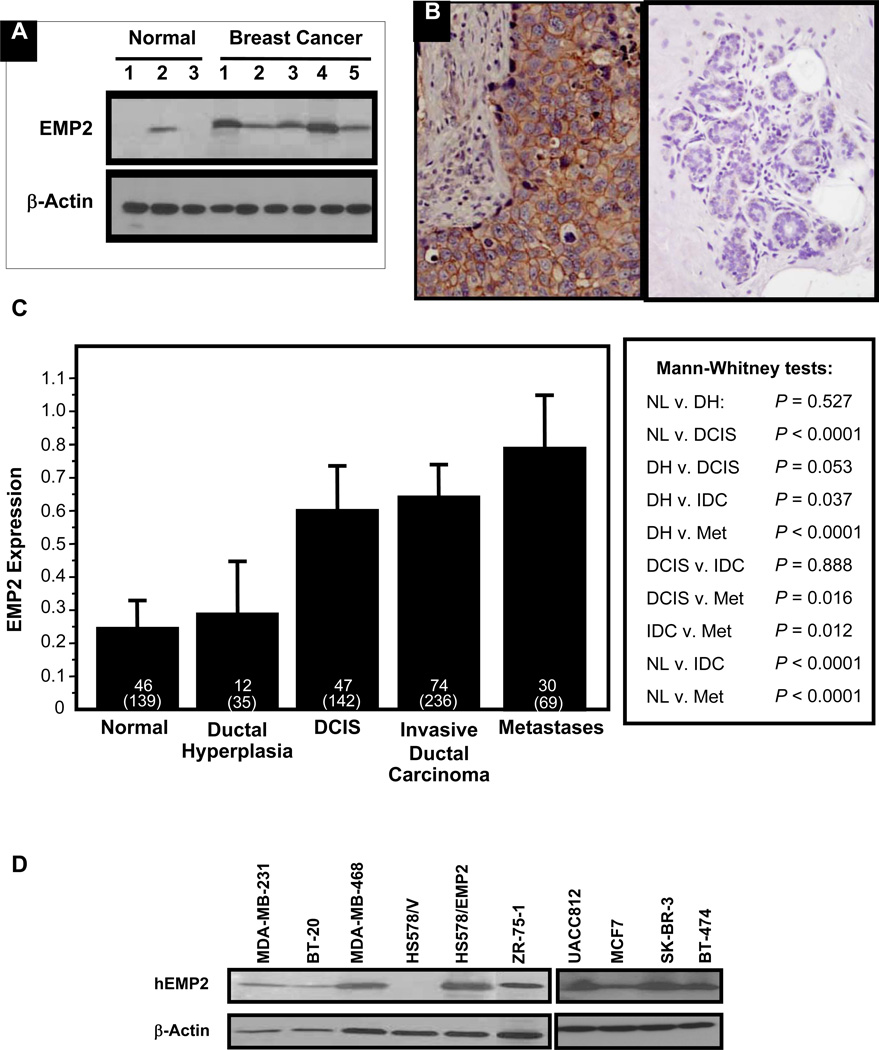
Figure 1. EMP2 expression is stratified by histologic type and stage.
(A) Western blot analysis was performed on whole tissue homogenates from normal and tumor regions of the breast. (B) Normal and breast cancer tissue were stained for EMP2 expression. Left, A representative patient with high EMP2 staining within a tumor is shown; Right, Representative staining in normal breast. (C) The mean integrated intensity of EMP2 protein expression for each category is shown using bar plots. The error bars represent the standard error of the mean. The top number represents the number of patients and the bottom number in parenthesis represents the total number of spots tested. (D) Expression of EMP2 in a panel of breast cancer cell lines was evaluated by Western blot analysis. HS578/EMP2 cells were generated to stably overexpress EMP2.

